ArcGIS Pro – My New Favorite Software

ArcGIS Pro ScreenShot of 3D Map

As a public works professional, one of the best things you can do in the new year is to check out ArcGIS Pro – a GIS mapping software by ESRI. I admit, like many GIS software products, ArcGIS Pro can be a little overwhelming to use right out of the box. Even though I am a regular user of ESRI’s older product, ArcMap, the user interface was nothing like what I was used to and the workflows somewhat different. But after trying it out for a few weeks, I have found ArcGIS Pro offers more effective features that increase flexibility, capabilities, and ease of use. It was definitely worth taking the time to figure it out.

If your workplace does not yet have a subscription, you can download a free trial to try it out. Because the new software is so different from past products, I went through the great tutorials ESRI has on their website to help me learn the software. After completing these trainings, I felt confident in making the switch to ArcGIS Pro for all of my GIS work.

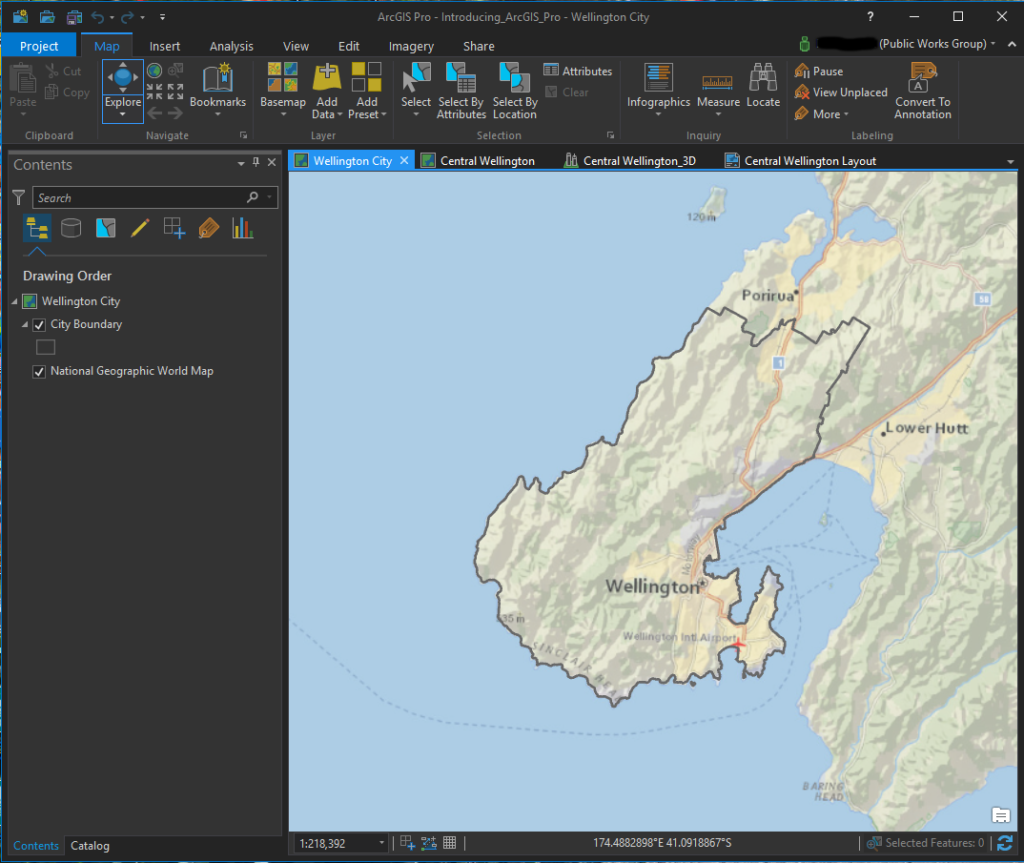
The best way to explore what ArcGIS Pro offers is to download the software and use it yourself so I won’t try to lay it all out here in this post. Instead I included a few screenshots from the tutorials so you can get an idea of the layout and look. The data displayed is for Wellington, New Zealand and is provided by ESRI for use in the tutorials.

In the screenshot below, you can see the menus are displayed across the top in a manner similar to other Windows-based products. A content window is located on the left and lists the data included in the map. When you start accessing other menus such as catalog or symbology, they will show up in this same space. Then you can switch between them by clicking the tab for each located at the bottom of the window. In this image, I only have the content and catalog menus open.

ArcGIS Pro ScreenShot of MapArcGIS Pro screenshot of a 2D map

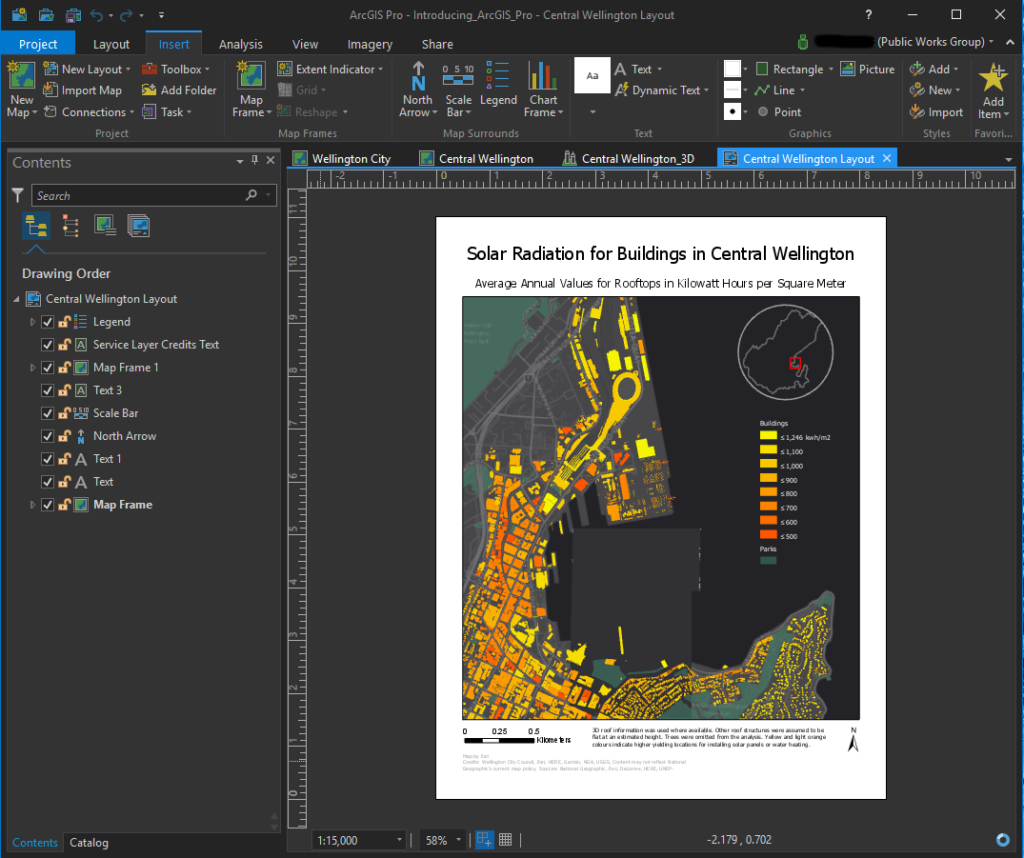
You can also see in this image several tabs shown above the map window. This is because ArcGIS Pro allows you to create multiple maps and layouts as a project rather than just creating one map at a time. With this format it is easy to switch between maps and layouts and copy data from one map to another. In the image below, a layout for this project is displayed.

ArcGIS Pro ScreenShot of LayoutArcGIS Pro screenshot of a layout

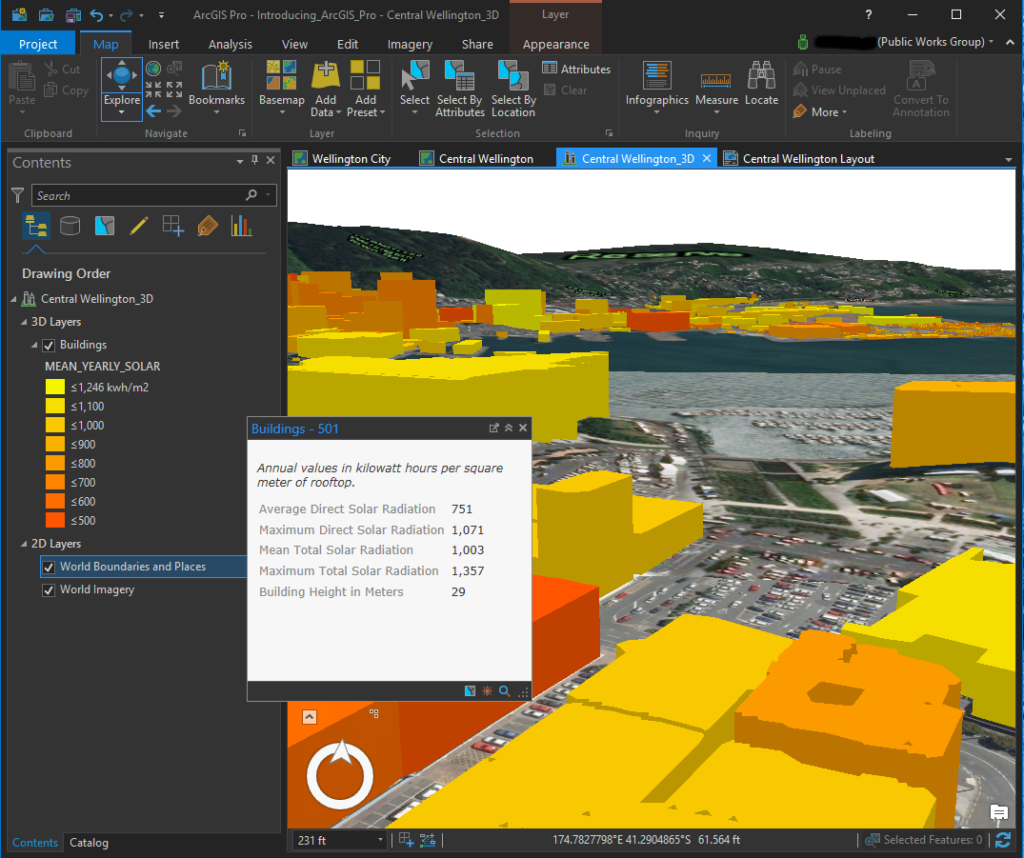
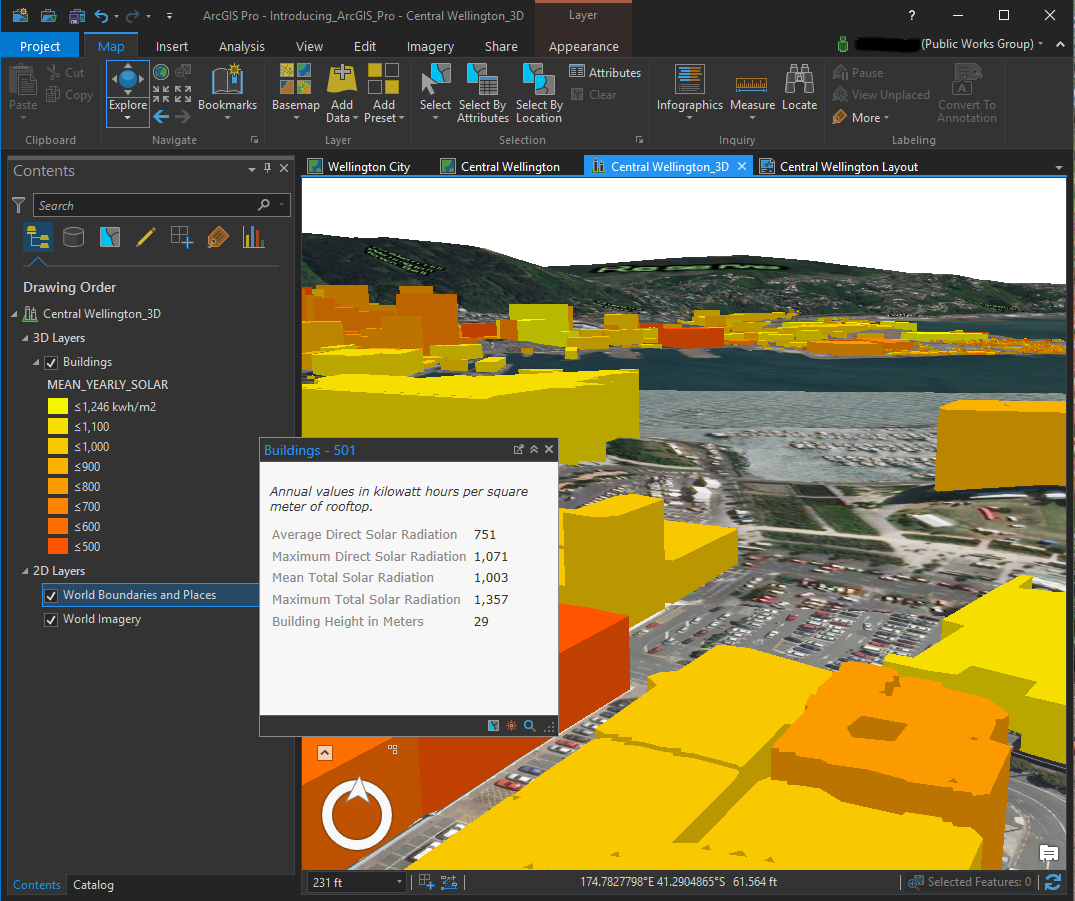
The other feature I really like is the ability to easily create 3D maps. Below is another screenshot of a map showing buildings in Central Wellington, New Zealand. This map displays the same data as shown in the layout in the image above, but in a 3D format. I clicked on one of the buildings to get a pop-out window of the information stored for that structure. Also I had changed the basemap to get an aerial view which displays more of a picture of the ground.

ArcGIS Pro ScreenShot of 3D MapArcGIS Pro screenshot of a 3D Map with data displayed

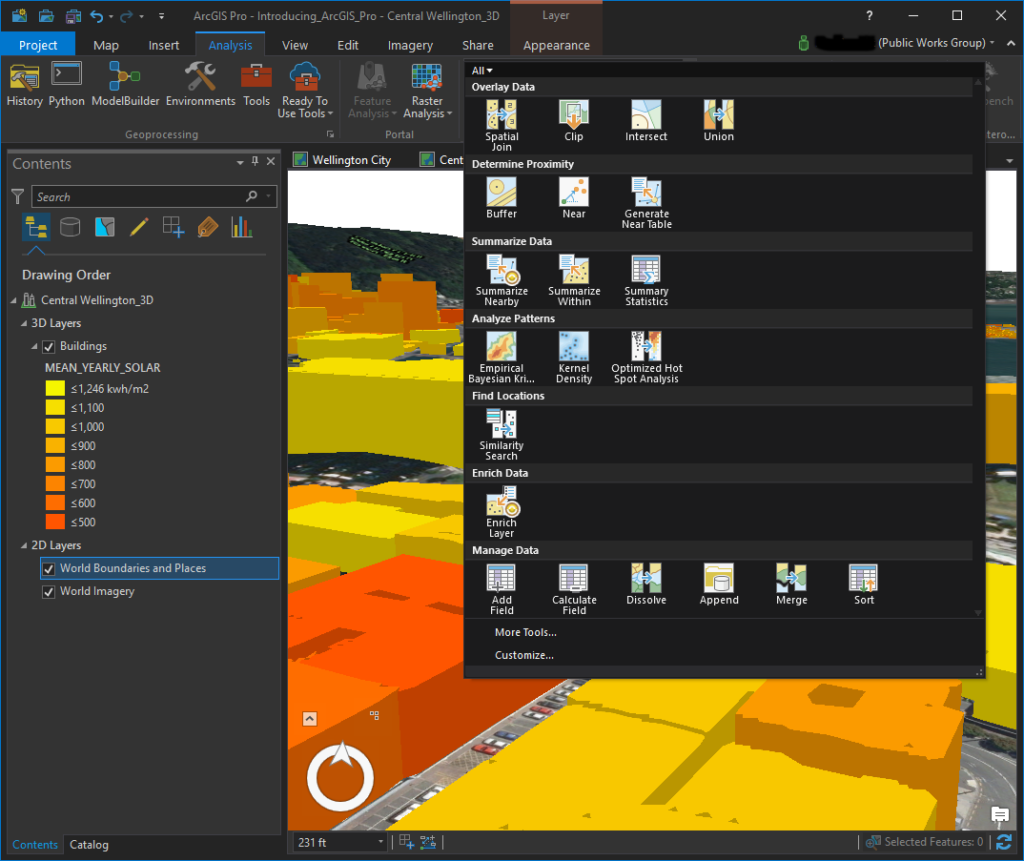
Finally in the screenshot below, I had clicked in the Analysis menu to display some of the tools available. You can customize these display windows to show tools you frequently use.

ArcGIS Pro ScreenShot of Analysis ToolsArcGIS Pro screenshot of available tools in the Analysis menu

Another added bonus with ArcGIS Pro is the integration ESRI included between the software and ArcGIS Online. With the Share menu, you can easily copy your maps to your ArcGIS Online account where they can be displayed as web maps or used to create other applications such as story maps.

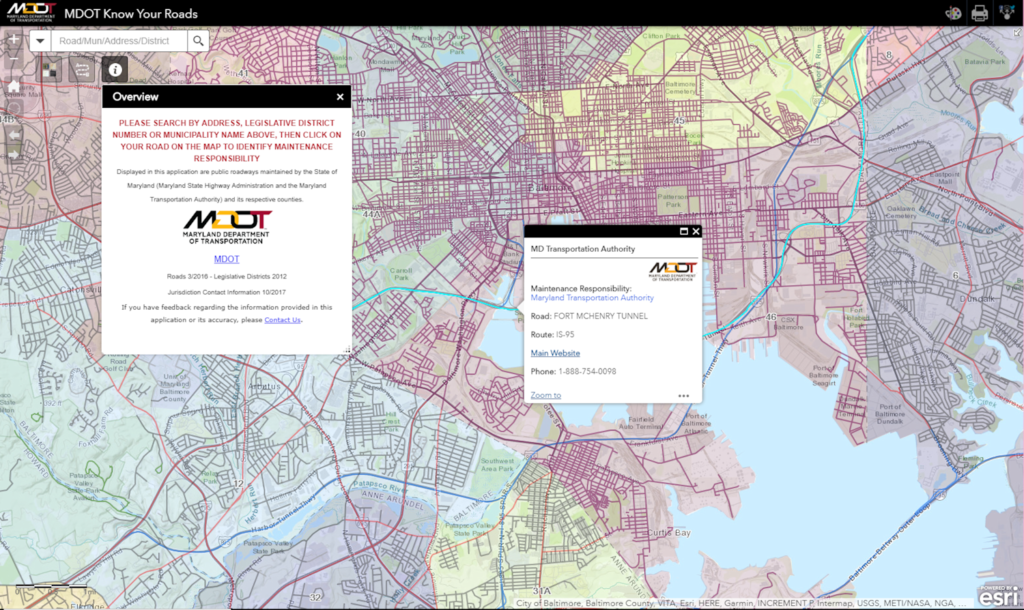
To give you an idea of why being able to easily share to ArcGIS Online is so important and powerful, I included just a couple examples of maps created and shared through that online service. The first is a very useful map created by the Maryland DOT. People can use this web map to figure out which entity has maintenance responsibility for any road in the state:

Maryland DOT Maintenance Responsibility Web Map

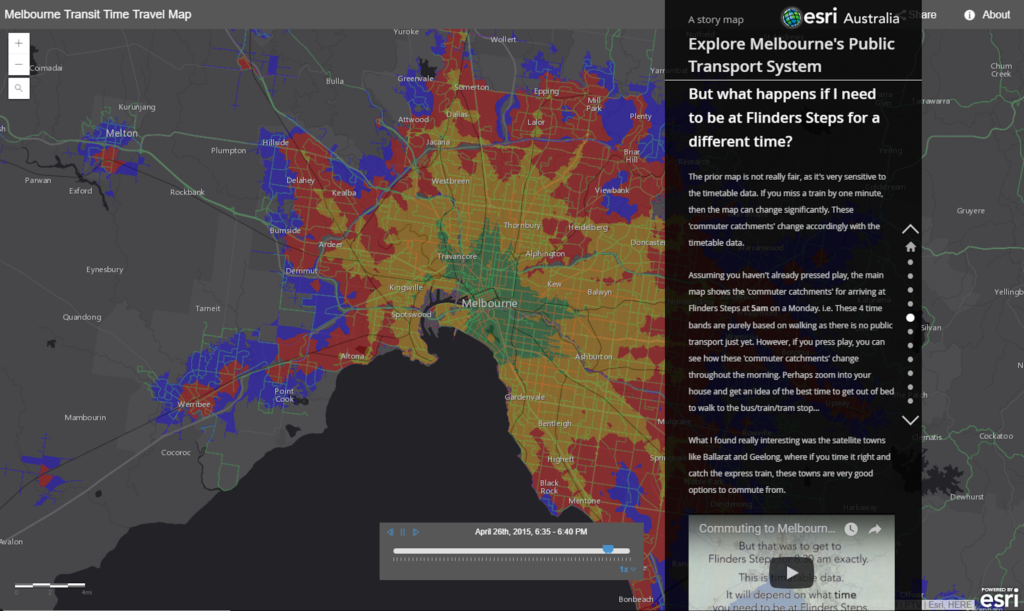
Another great example is this story map of public transit in Melbourne, Australia. This particular application displays a lot of the features and capabilities offered by story maps:

Melbourne Australia Transit Story Map

Finally, if your office doesn’t offer ArcGIS Pro for your own use or your free trial runs out, ESRI offers a fairly low-cost subscription option for people who just want access to the software for personal, non-commercial use. You can find out more about ArcGIS Pro for personal use here: http://www.esri.com/software/arcgis/arcgis-for-personal-use


Share

3D Printing for Civil Engineers

3D Printer

3D Printer
3D printer
Lately I've been thinking our field might be missing out by not exploring the opportunities offered by 3D printing. Even though 3D printers have been around for many years, I haven't seen anything significant related to its use by agencies or firms in our field. I remember a 3D printer in use in a classroom at the college where I used to teach and that was at least 13 years ago. But that printer was used by the mechanical drafting students – not those in the civil technology field. So my partner and I have embarked on the goal of learning more about 3D printing and how the technology can be used in the civil engineering field.

Fortunately we found a learning program hosted by the University of Illinois in Champaign-Urbana which also happens to be our alma mater. The program is offered through Coursera and is a series of 5 courses leading to a specialization certificate in 3D printing. We began the first course right at the start of 2017 and are almost finished with the second one. So far the content has provided a good introduction to 3D printing and offered ideas about how it has been and could be used in many different fields.

Near the end of the second course, we were introduced to Josh Ajima, a teacher in Northern Virginia. In his presentation, he described how he created 3D representations of the earth's topography to visualize how different areas of a watershed relate. A description of his work with fabricating the Chesapeake Bay Watershed can be found in his article, "Design Challenge: Chesapeake Bay Watershed." Civil engineers can see right away how 3D printing an area's topography can lead to better understanding of watersheds, flooding impacts, material transport, and other related concepts.

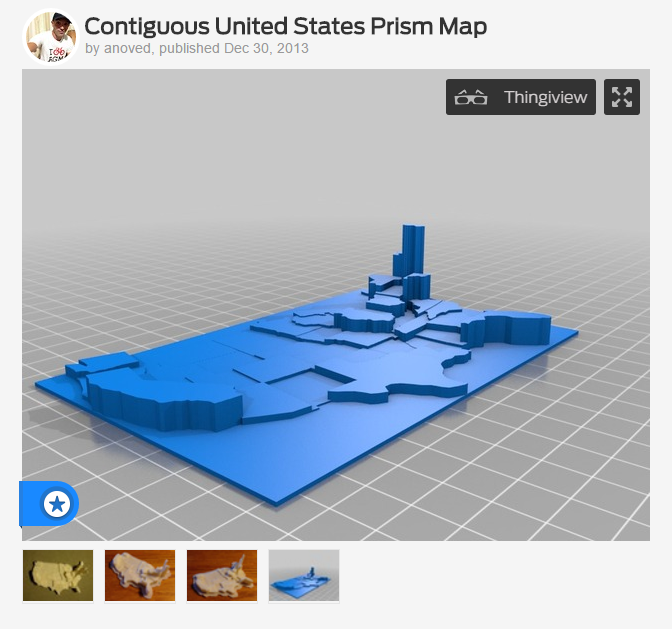
Then, in our effort to learn more about the local 3D printing community, we attended a workshop at the Maker Lab in the Harold Washington Library in Chicago. There we saw a printout of the topography of the bottom of Lake Michigan. We were also introduced to the idea of using 3D printing to display data. An example of this type of use can be found on a 3D printing site called Thingiverse where the user anoved has uploaded a model of the United States to be used to visualize data sets for the states. A screenshot of anoved's Thingiverse page with the map is shown below. We can imagine an agency using this model for public education to show the amount of transportation funding spent by each state or the number of highway fatalities or miles of roadway.

Thingaverse Example of US 3D printed map with data

I'll continue to share our experiences with 3D printing as we learn more about the technology and increase our understanding of how it might fit into civil engineering. In the meantime, if you are interested in learning more, I'd encourage you to check out the classes on Coursera – they are free to take if you are not interested in earning a certificate for the specialization. You can also visit Maker Labs in your own areas – they are usually found in most larger cities, particularly in libraries. Also, if you know of any uses of 3D printing in our industry, we'd love to hear about them – just drop us an email, comment below, or reach out to us on social media.

Share

Augview – a Window to Your Underground Assets


Water Main Installation

Augview, founded by Michael Bundock in 2012 in New Zealand, is the first commercial, mobile application I have seen offered to the public works industry allowing utilities to geospatially capture, store, and display underground utilities in 3D through the use of a tablet or other mobile device. The software, through the use of GIS, will show operators their water, sewer, or other underground lines superimposed in 3D upon the ground in a geospatially accurate position. Users can then query the lines as with any other online GIS and access data about that utility such as size, material, age, and any other type of stored data. Or if a locator finds a discrepancy in a line's location or if he finds a new line, he can enter it into the software and immediately verify the updated or new location is accurate.

One example I can think of where I could have used this type of device was when we found a patched area in a roadway on one of our projects. It was one of those typical failures you find where you can see someone repaired something, but there's still something going on because a small hole opens back up with a void underneath. A lot of times this is caused by a hole in a sewer which allows soil above the pipe to wash away into the line leaving a void under the pavement. I knew the city had a sewer running along the roadway near that area, and I noticed a water shut off box nearby in the parkway. Because in our area the sewer lines used to be run with the water lines, I suspected it could be a failure with the building sewer. The business owner came out to comment on it and mentioned there had been a problem there, but it was difficult for me to tell for sure from what she explained if it had been the city sewer or the building owner's line. If I had Augview, I would have seen how all these lines related and where they were located. This visualization would have offered a better prediction of exactly which line could possibly have a failure. Of course public works professionals already try to make this determination using paper maps, but if it was the building owner's line, it is much easier to explain the problem to them using a 3D representation of everything rather than expect them to read a utility atlas.

I would have also liked to have an application like Augview for management of our water network. Our crews could have used the application to document the valve position when they opened or closed it. Then we could have just driven by to see if we had opened them all back up after we repaired the break, or we could have noticed when a valve between our pressure zones accidently was opened.

It would also be useful to use Augview to look at non-utility data for something like visualizing roadway ratings in the field. Then each year when we went out to rate the roadways, perhaps Augview could color the roadway based on the rating we assigned the year before in our GIS. This would prevent us from juggling paper maps in the truck while we are trying to also view and assess the pavement.

Past articles on this site have also imagined one day a product like Augview could be used to assist contractors as they build by displaying not only the underground lines but actually superimposing the plan onto the site. And I don't think it will be long before this type of implementation is extended to allow us to display real time data too. I can see one day we will be able to look up at the water tower and actually see the level of water in it or be able to see an indication at our water or wastewater plants of the flows running in and out and through each process. It would also be interesting to be able to drive by our lift stations and see the whole area colored red or green rather than just see the little red/green run light. This is also another facility that could display flows, seal failures, water levels or any other type of data.

While at the present time Augview has primarily been implemented in New Zealand, Melanie Langlotz,  business development manager, said she is "also looking for interested parties in the U.S. who can see the possibilities." So I believe it won't be long before we see Augview in use throughout the U.S. and other countries.

You can find out more about Augview by watching the video below or visiting their website or other social media sites:

Share

WATERCON2014

This year I am fortunate to again have the opportunity to attend WATERCON in Springfield, Ill.It's amazing how every year the conference offers so many great sessions, and the exhibitors always have such interesting displays and information. In addition to attending sessions and talking with vendors, I'll be posting as much as I can on several social media sites so that all of you can follow as much of the conference as possible. Because most of these sites are already listed in a blog post over at the Watercon blog site, I won't list them again here. Instead I encourage you to visit over there. And if you're attending too, I'll be looking for your own posts and photos from the event!

One added treat is a virtual expo we set up to try out that technology. Here's an image of the entry screen – you can find the link to visit the expo over on the Watercon site.

Watercon Virtual Expo Image 

Share

Using Google Street View for Engineering Submittals

Many people are probably familiar with Google Maps. This online tool offered by Google allows you to see an aerial view of a specific area and get directions and travel times from one address to another. Some might also take advantage of Google's "street view" which allows you to see a location as if you were standing there looking down the street. Of course, this is only available if Google has added street view capability to the roadway – in some cities it is still only accessible along major roads. But because we now have street view available on all the roads in our city, I've been using it quite a bit at work – it's a quick and easy way to check out features along a road. But the other day I discovered another very useful capability hidden within all that Google goodness and thought I'd share it in case someone else was like me and didn't realize it was there. 

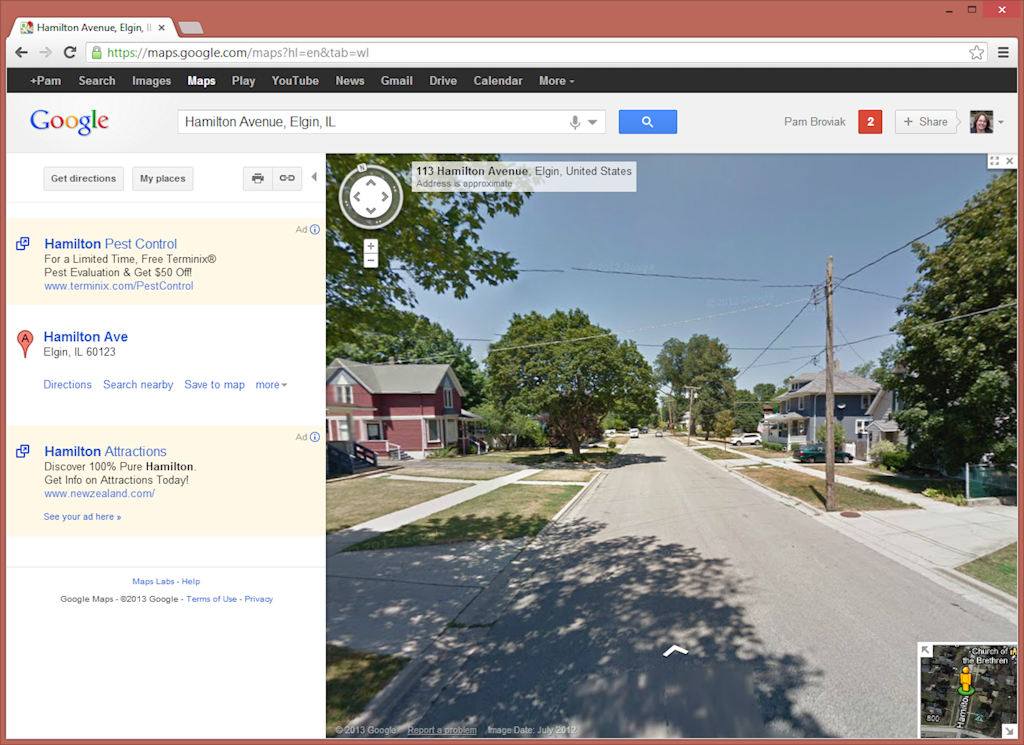
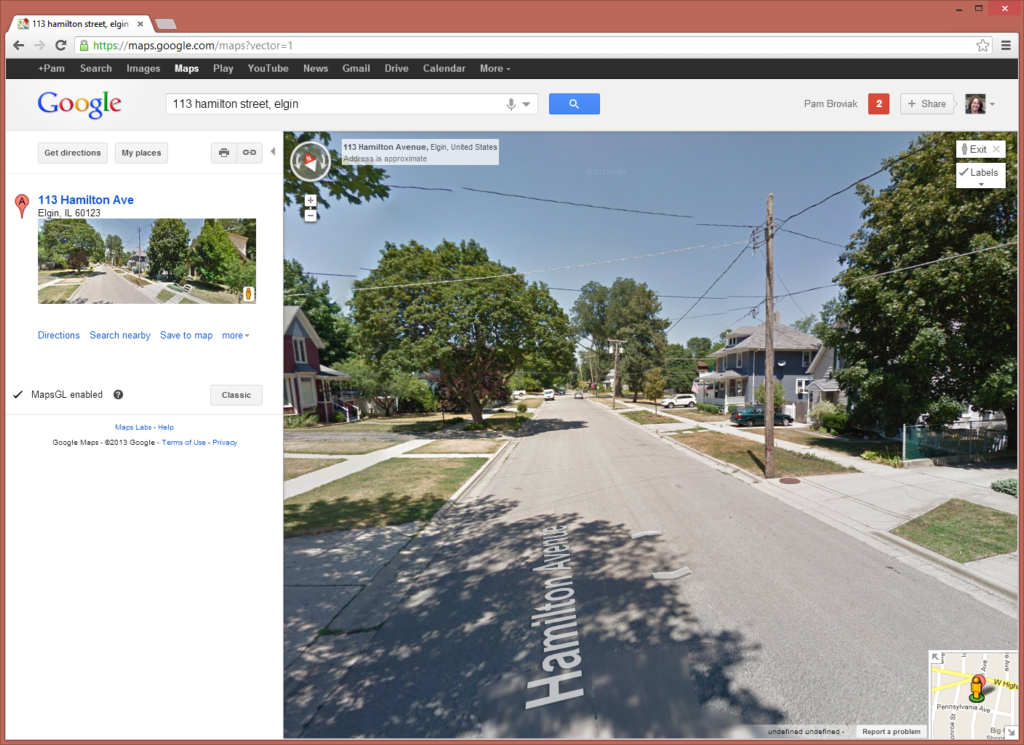
I was preparing a submittal for a project to be reviewed by a state agency and needed some photos of the street where the project was located. For this particular submittal all I needed was a general photo of the street that would show it was a typical asphalt roadway in a residential area. At first I looked to see if there was one available on the computer, but no luck. Just as I was wondering about having to go out and take some photos, I thought about using street view to see if that image would work. So I went into Google maps and dragged the little orange guy down from the upper left of the map to the road where I needed the photo. It was the perfect photo for my purpose. Using an example of an address in a neighboring city, I figured I would walk you through what I did and what I found. Here's how it looks when you zoom down to street view:

Google Street View

Now, that's a nice simple image that shows perfectly the type of image I needed to submit to this agency. I also noticed that Google offers an updated version of Google Maps called MapsGL so I switched over to that to try it out. You can see the difference below. One nice addition is the road name displayed on the roadway:

Google Street View MapsGL


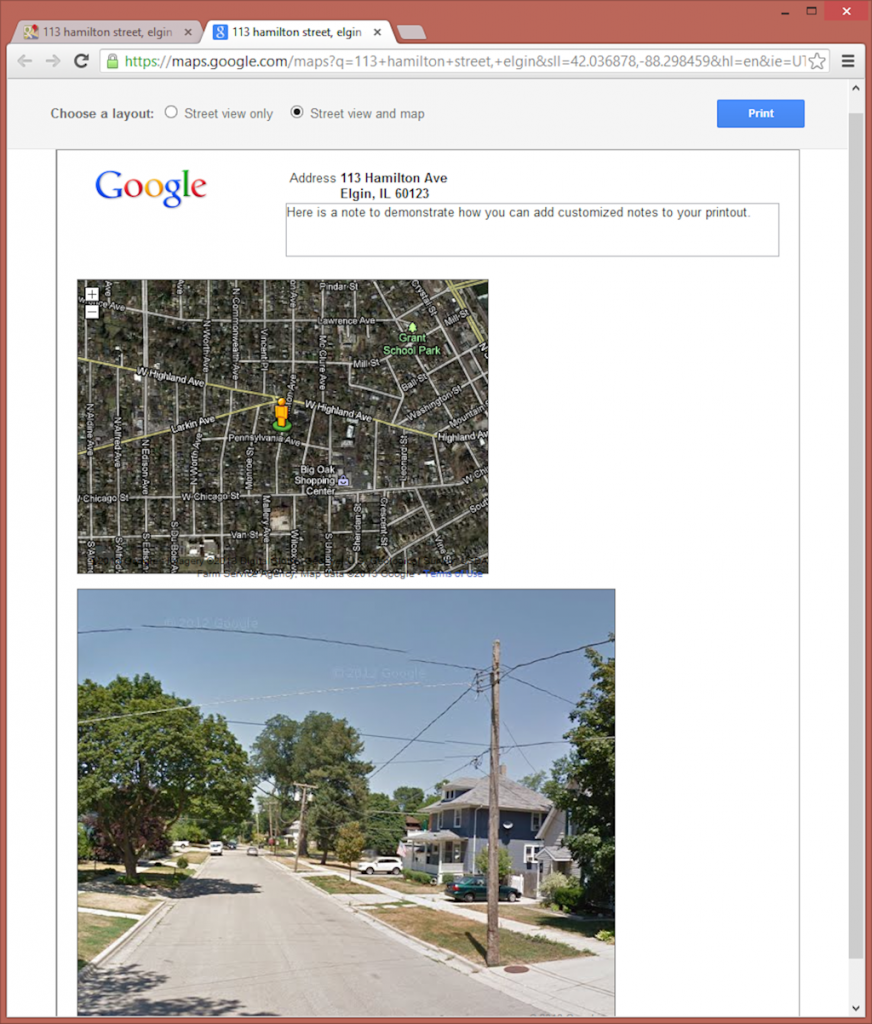
So just as I was trying to decide what program to paste this screenshot into for preparing an exhibit for the submittal, I noticed the print button. I figured let's see what it looks like – maybe I can get away with just using that. So I clicked the little printer icon and the following page was created.

Google Street View Printout

Wow – I thought, that looks pretty good. Google already has set it up on the page in a professional enough looking manner that I can just use that. They show the location and even offer the ability to type my own note and add any information the agency might need. (As an aside, I also noticed it looks like the latitude and longitude are displayed in the URL so if you needed that in the note, you could also copy and paste it from the URL.) But just as I was getting ready to print this from my browser, I noticed something else – Google offers another display option that includes the street view and a map. So I clicked the little button at the top of this page next to "Street view and map" and got the following:

Google Street View Printout with Map

How can you get better than that?! I have the perfect photo and a map all displayed in a simple and nice manner on a page that is all ready to print out by hitting that blue print button. Can it get any easier than that!? Maybe it seems silly to get so excited over something so simple, but for me, this saves the time it takes to go take a photo, download it to the computer, get it into a program, and create an exhibit. Sure it's not hard or difficult, but it does take time. I figured Google saved me at least a couple hours of my time the other day since I had four locations where I had to get this information. Doing it in this manner took only five minutes, and I have to admit, with the map, looks better and more professional than any of the past exhibits I have made for this same purpose. 

Go Google! Making us better engineers one little app at a time!

Share

Publishing GIS Data to a Google Map Using Fusion Tables

At work we've been focusing a lot on development of web maps. We have an ESRI ArcGIS Server so we've been trying out the JavaScript, Flex, and Silverlight options available. But we've also been exploring the mapping/GIS opportunities offered by Google. This week, I needed to create an embeddable map that I could easily generate and place into a website. So I looked online for how to take our GIS data and get it published on a Google Map. I realize this can be done using a KML file, but I really wanted to use the Google Fusion Tables to display the data in map form. And I just could not find a set of clear directions on how to do this. Perhaps my search skills are lacking, but after coming up with nothing, I spent some time figuring it out myself using the few clues I could locate online. And because we have quite a few people at work who also use GIS and might want to publish their data on Google Maps, I decided to create a guide of how to do this. There might be an easier method or one that is not so conservative of an approach, but I know this works, and it didn't blow anything up. And since I already had the work done, I figured I'd share it here too in case it might also help others out.


Publishing GIS Data to a Google Map Using Fusion Tables

Open ArcMap, and create a new, blank map. Then open ArcCatalog in ArcMap and browse to your data. Drag the file with your original data into ArcMap.

(In my example, I am using our Stormwater Restrictor feature class. This feature class was created from a set of data points collected in the field using GPS and processed in the office to create this file. It was then added to our engineering SDE Geodatabase. I also obtained some of the information about calculating fields from this blog post: http://nativecho.wordpress.com/2011/04/12/arcgis-10-0-calculating-geometry-to-display-decimals/)
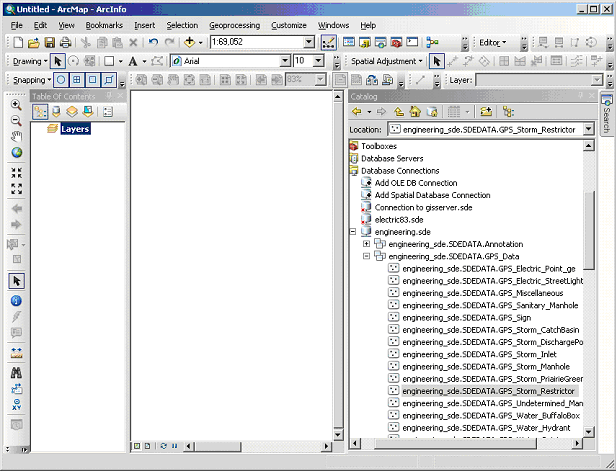
Finding your file in ArcCatalog within ArcMap

Checking the projection of your data

Because your original data is probably not in the same projection used by Google Map (WGS 1984 Web Mercator), you will need to re-project your data. You can check to see what system your data is on by right clicking the name of your feature class under “Layers” and choosing “Properties” from the pop-up menu. Click the “Source” tab in the Layer Properties window to see the Projected Coordinate System. When you are done viewing the projection information, cancel out of this window without taking any action.

Our data is on the NAD_1983_StatePlane_Illinois_East_FIPS_1201_Feet Projected Coordinate System—Transverse Mercator:
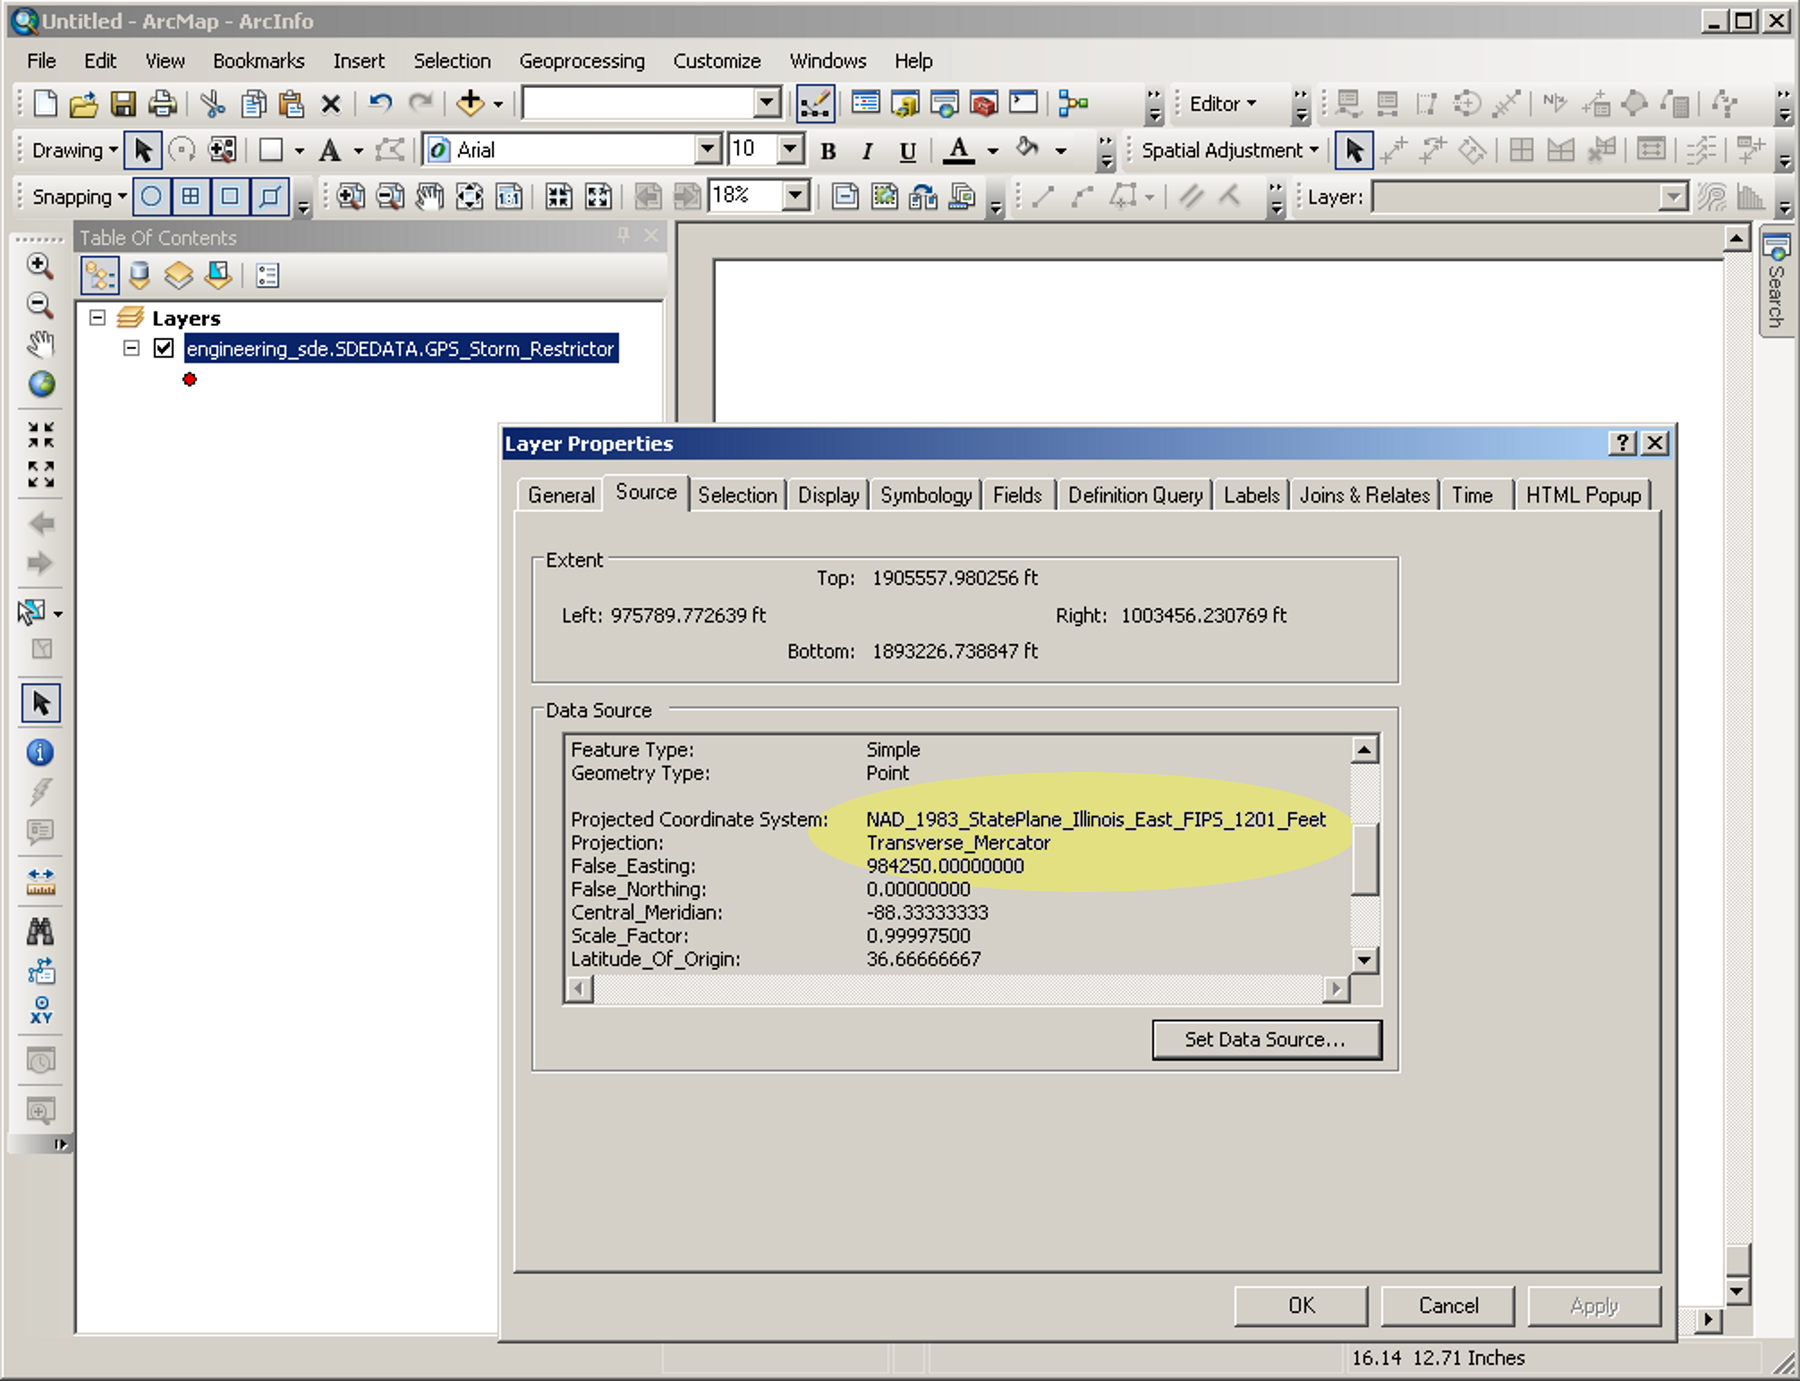
Checking the projection of your data

Creating a new shapefile from your original data

Because I do not want to change my original data or work in the geodatabase, I am first going to export my data to a shapefile. To export, right click the name of your feature class in the Table of Contents window in ArcMap. Then choose “Data” and then “Export Data” from the pop-up menu. For the “Output Feature Class” navigate to a folder location where you would like to store your shapefile. Choose a name for your shapefile; then hit “OK.”
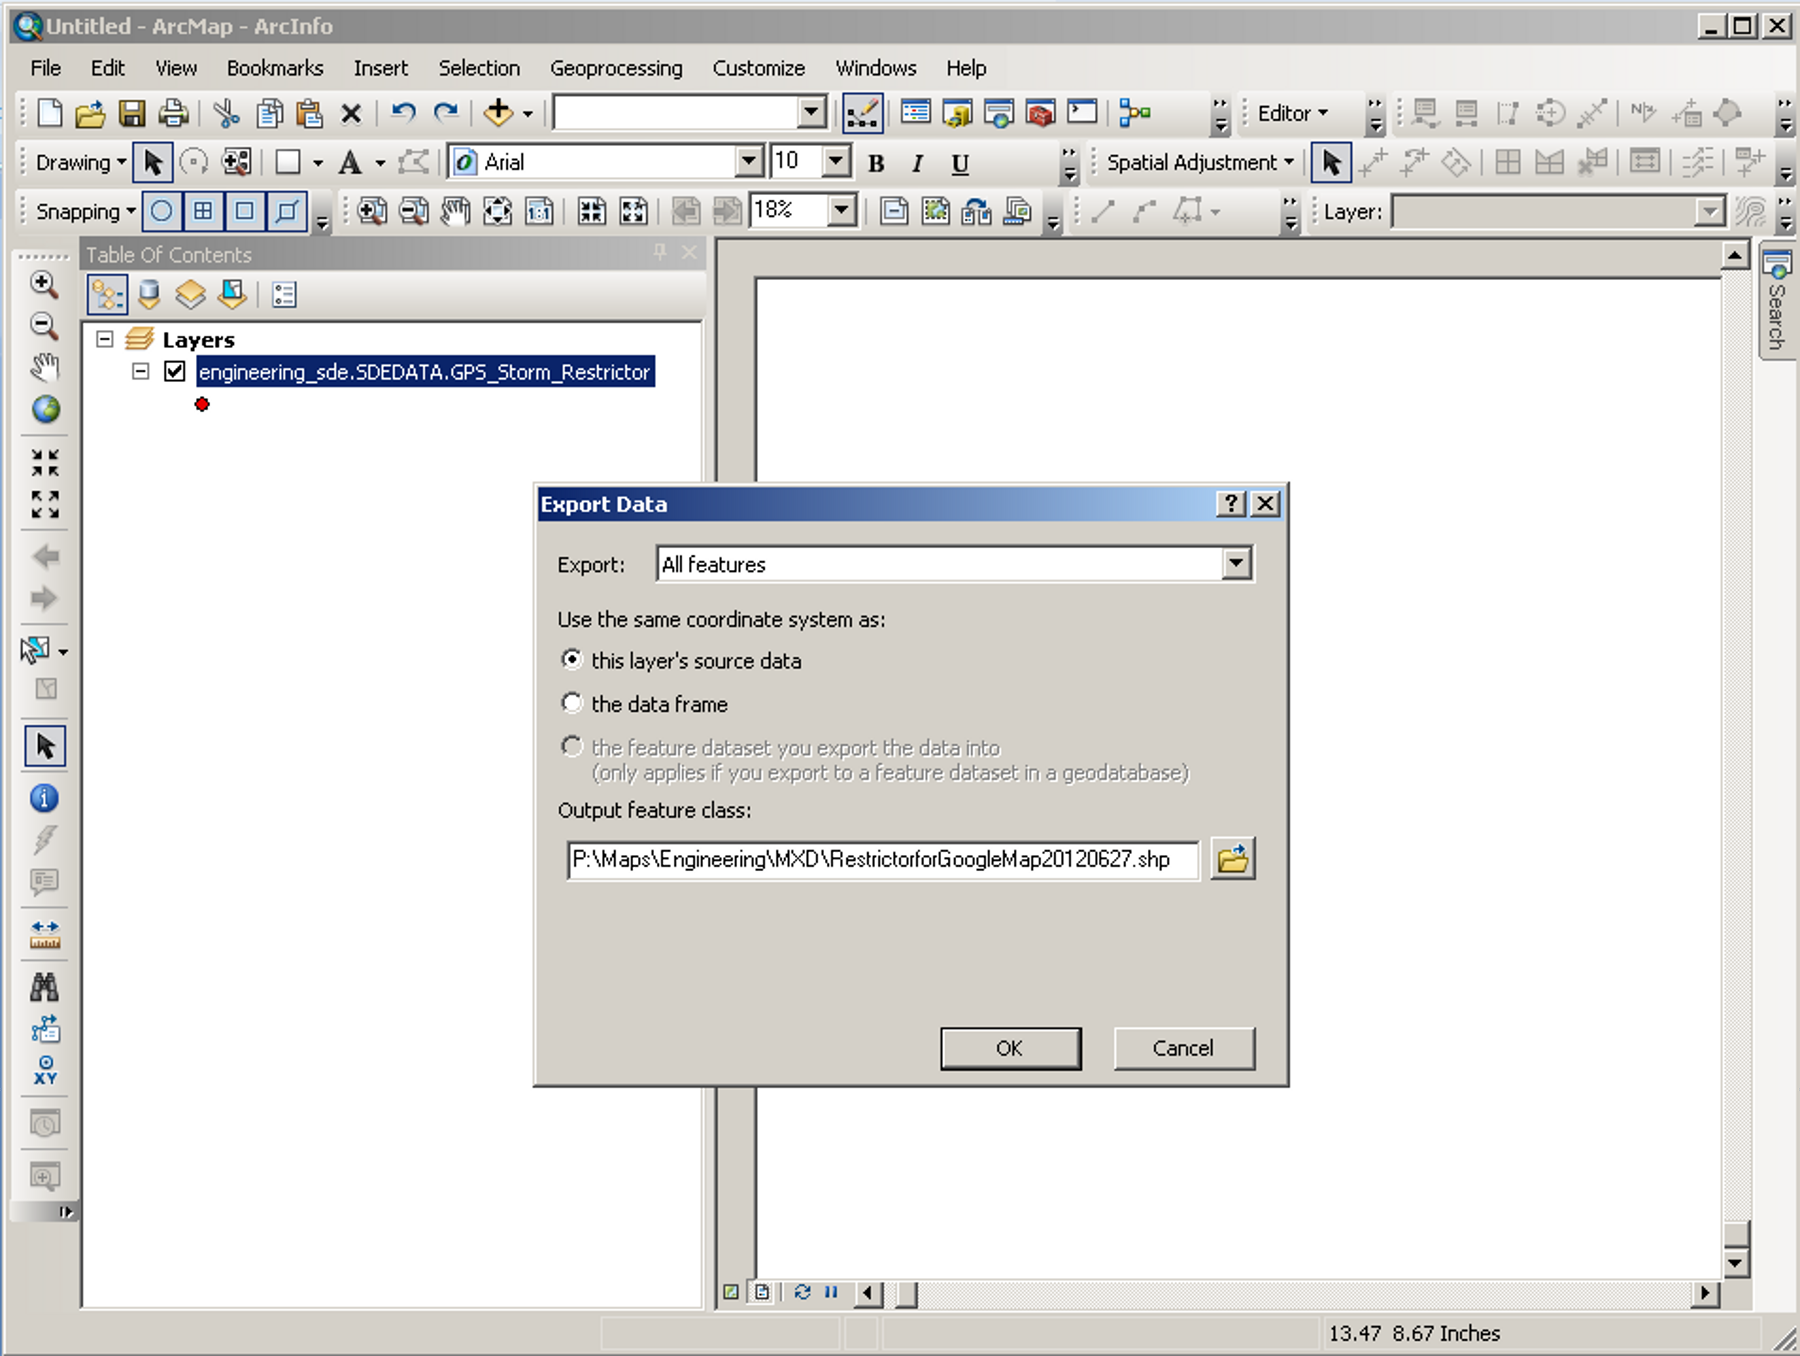
Exporting your original data to a new shapefile

This will create a shapefile you can work with so you will not change your original data.

Next, close this map without saving and create a new one. Open up Arc Catalog in ArcMap and navigate to your new shapefile. Drag this into your new map and close out of ArcCatalog.

Re-projecting your data

We are now going to change the projection of the data in your shapefile. First right click the word “Layers” in the Table of Contents window in ArcMap. Choose “Properties” from the pop-up menu. Then choose the Coordinate System tab. The top window is showing your current projection for the data frame of your map. You can select your new projection from the window at the bottom. Navigate to “Predefined,” then “Projected Coordinate Systems,” then “World,” and finally to “WGS 1984 Web Mercator.” This is the projection used by Google Maps. Make sure that projection is the one highlighted as shown in the example, then click “OK.” Note that when you highlight this projection, it will change the display in the Current coordinate system box as shown in the image below. After you click “OK,” a Warning window might pop up—just choose “Yes” to indicate you wish to use that coordinate system.
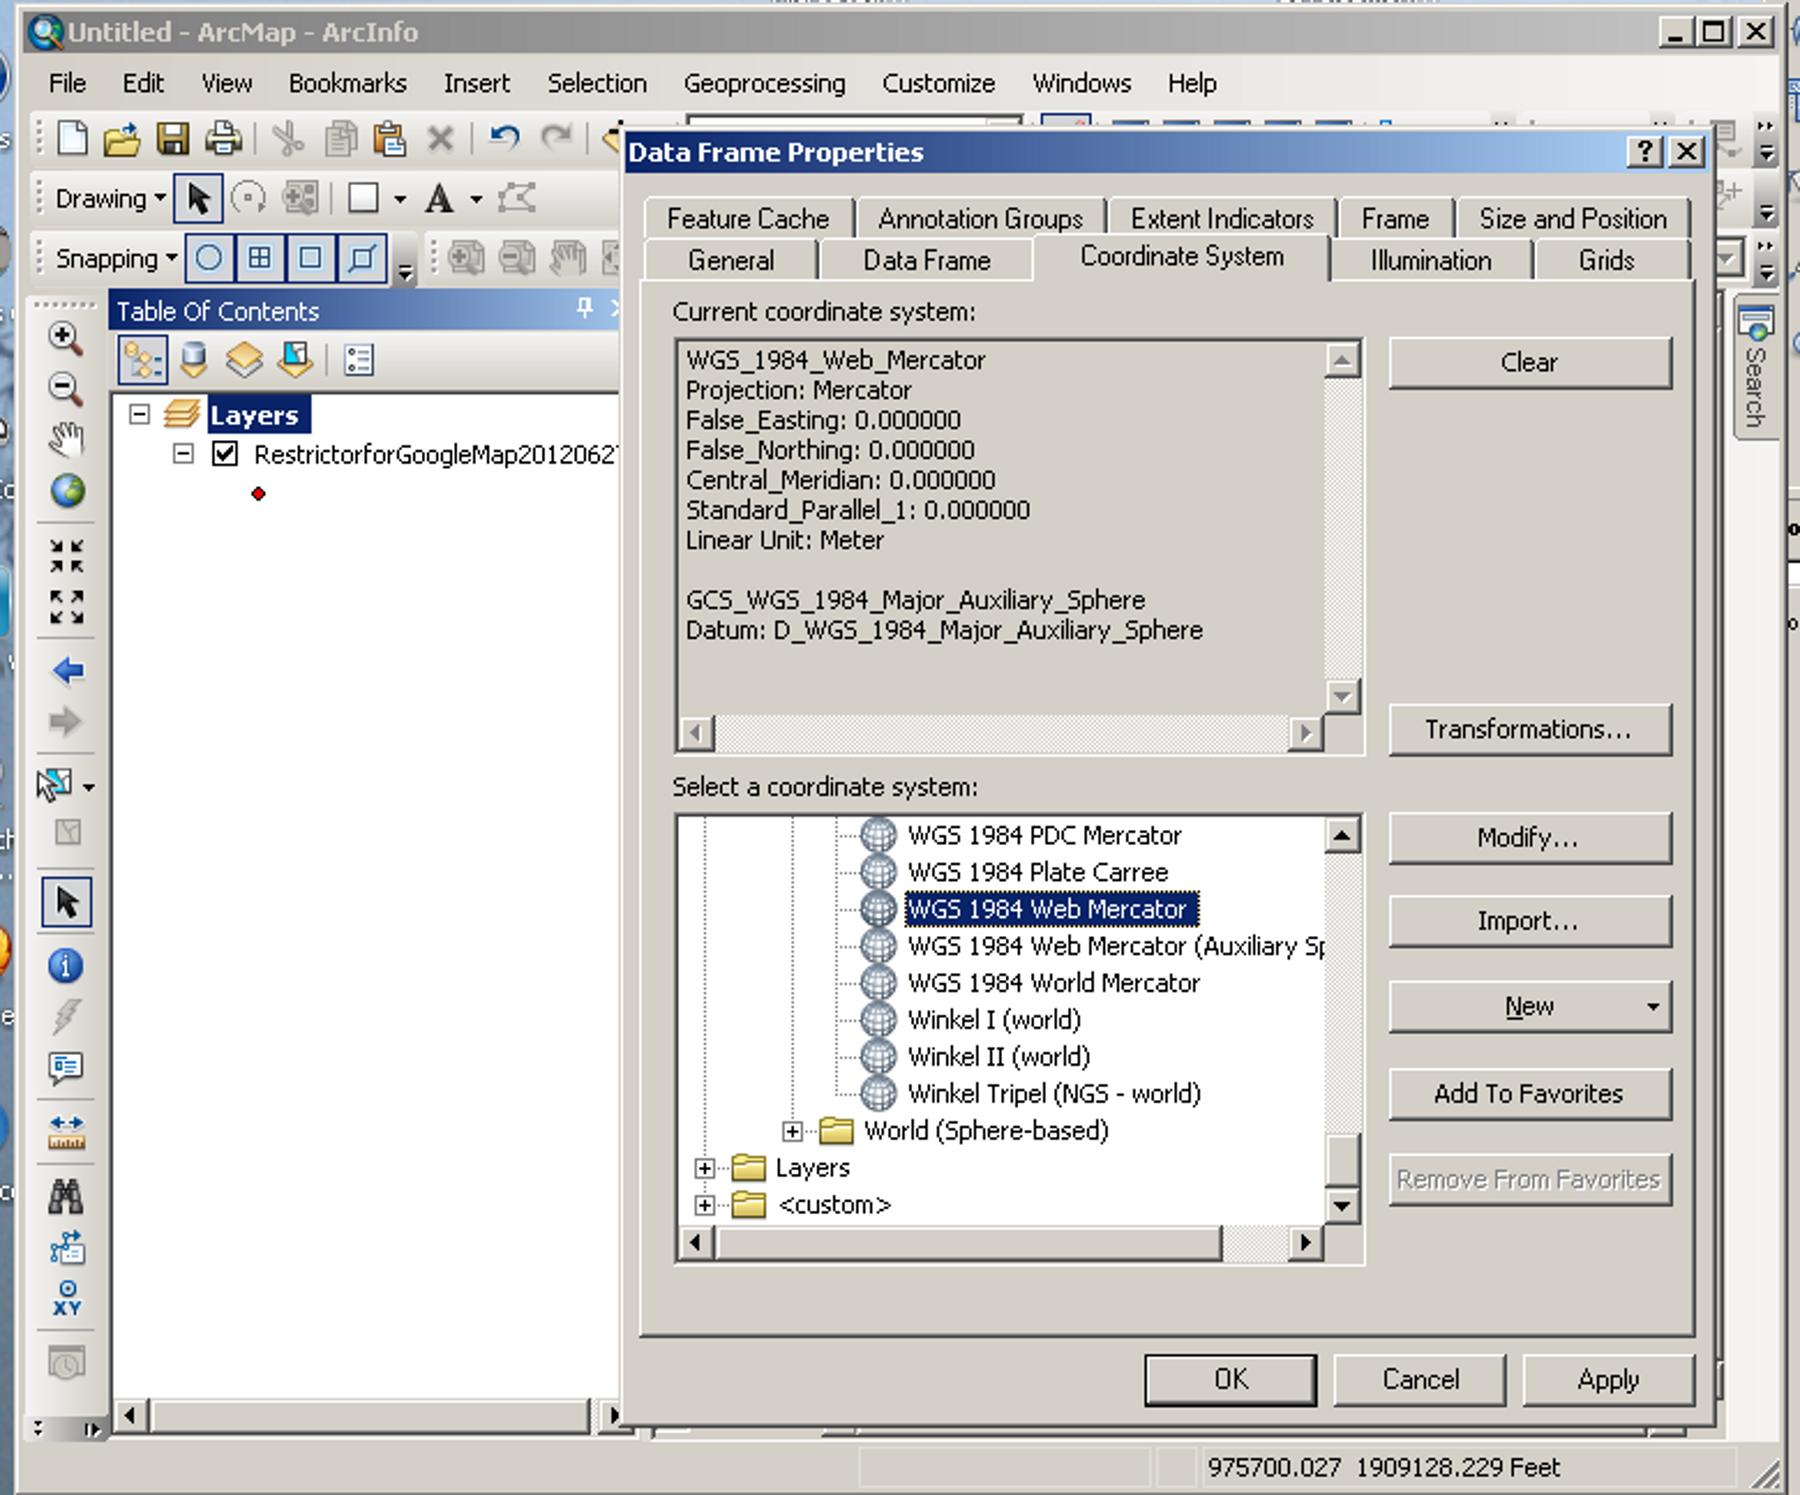
Choosing a new projection for your data


Now you will right click on your feature class name in the Table of Contents window and again choose “Data” and “Export Data” from the pop-up window. This time, make sure to change the choice of the coordinate system to “the data frame” as shown in the image below. Navigate to where you want to save your new file, and choose a name for this new, re-projected shapefile. Then click “OK.”
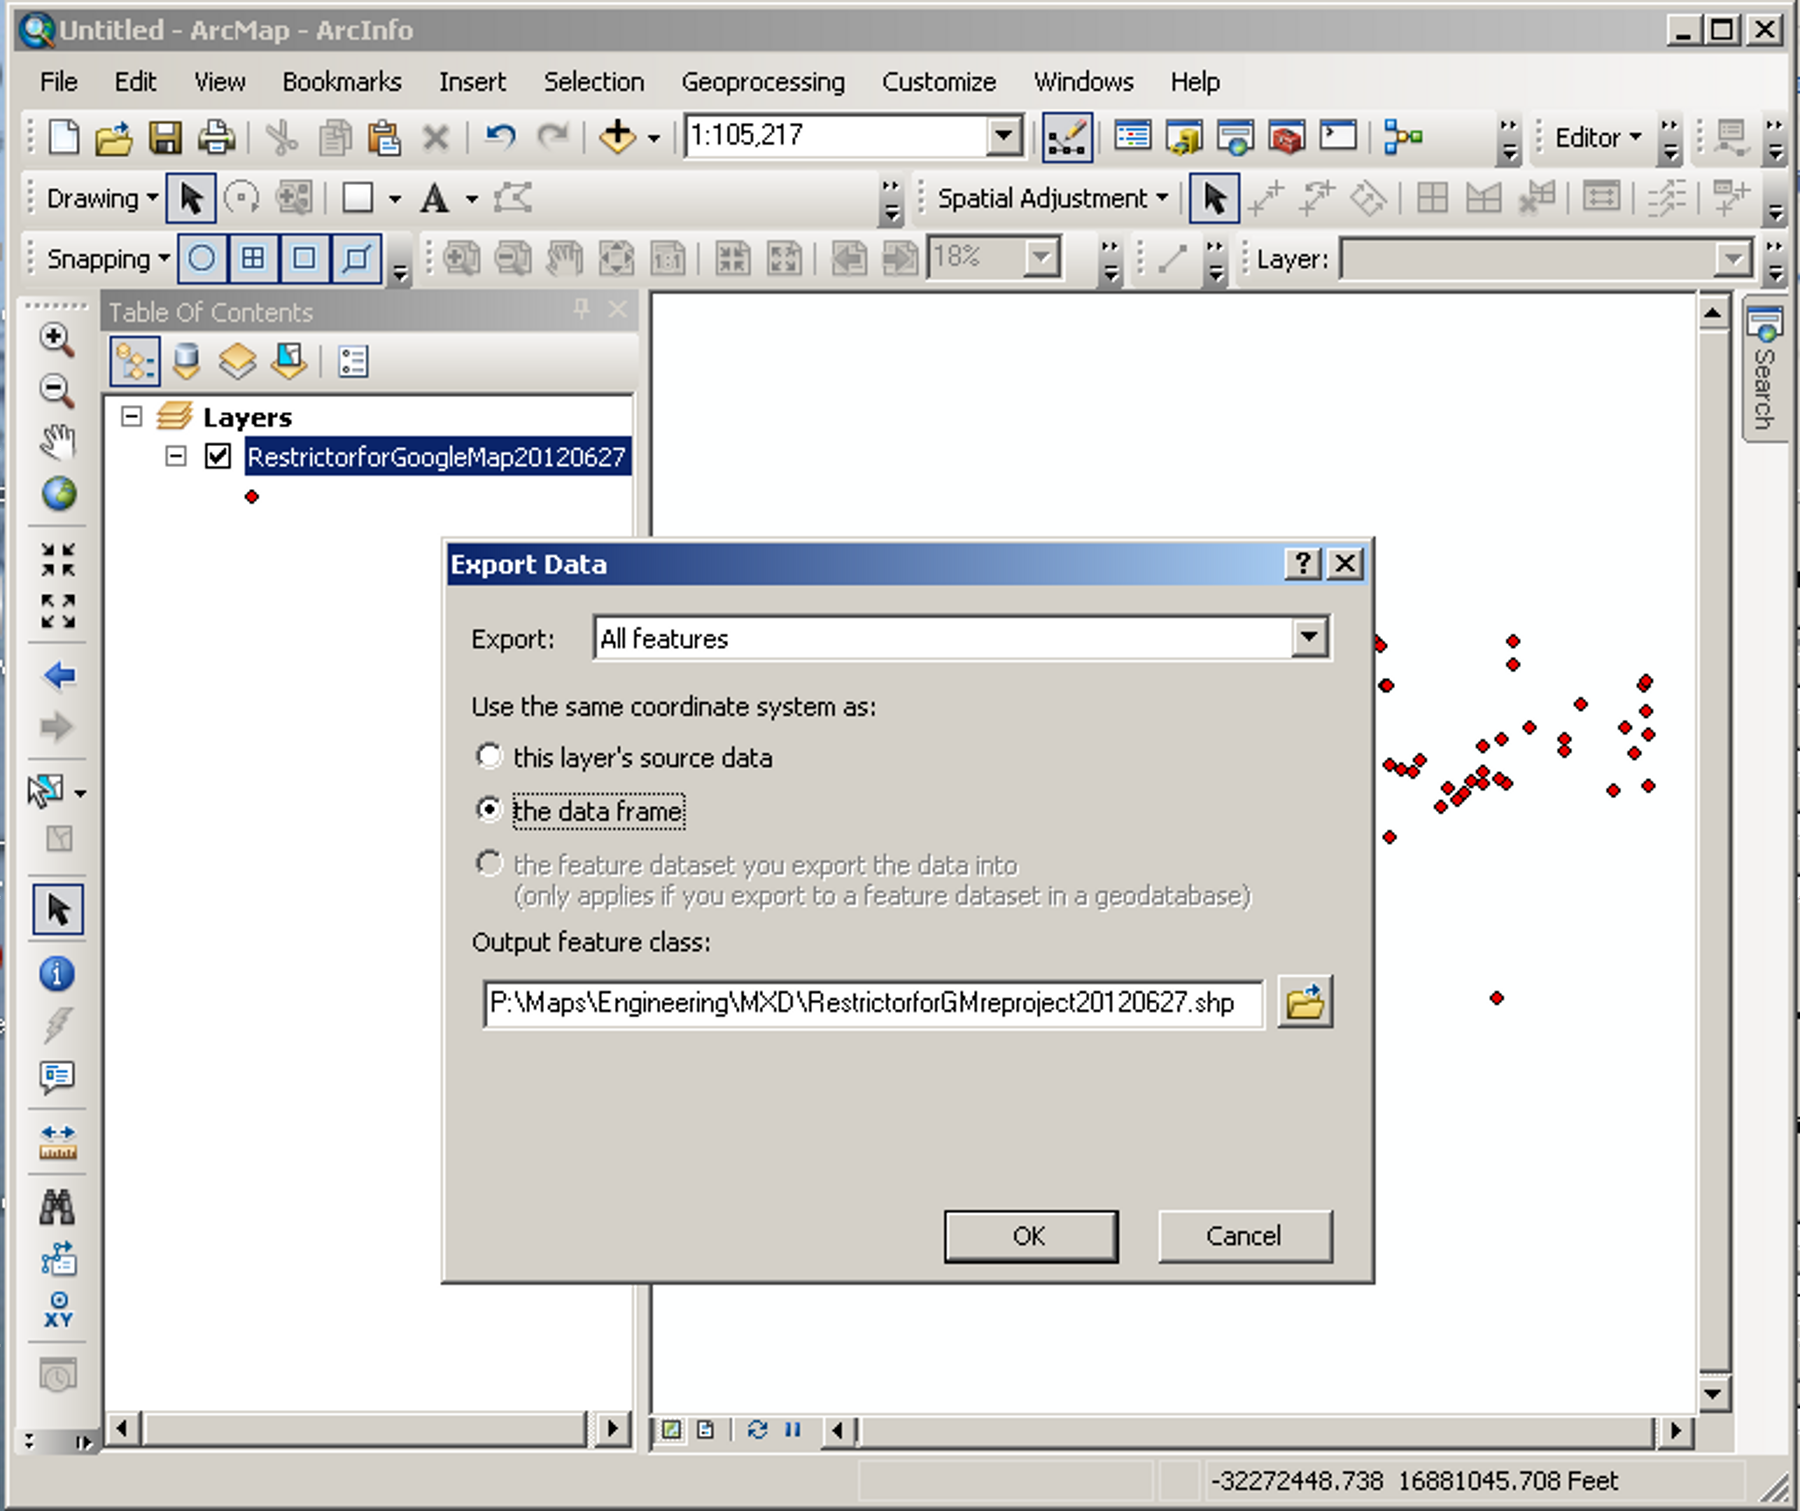
Exporting the re-projected data


Adding latitude/longitude fields to your shapefile

Now we will close out the map without saving and create a new map. Open ArcCatalog again in ArcMap and navigate to your new shapefile. Right click on the new shapfile (in my example it is “RestrictorforGMreproject10120627.shp”) and choose “Properties” from the pop-up menu. Choose the “Fields” tab in the “Shapefile Properties” window. Then scroll down so you are viewing the bottom of the list of the fields. Here we will add two new fields, one for Latitude and one for Longitude, as shown below. Make sure the Data Type is “Double” and keep the default values of “0” for Precision and Scale. Click “OK” and drag the shapefile into your new map. Close out of ArcCatalog.

Adding latitude and longitude fields to our re-projected shapefile


Setting up the latitude/longitude fields

Now we are going to work towards calculating the Latitude and Longitude for each point in our feature class. Right click on the name of your feature class in the Table of Contents of the new map. Choose “Open Attribute Table” from the pop-up menu. In my example, the attribute table is docked above my Table of Contents and my map window. In the attribute table navigate over to the Latitude and Longitude fields. They should have 0 for all the entries. Click on the top of the column on the word “Latitiude” in the column heading to highlight the field. Then right click and choose “Properties” from the pop up menu.
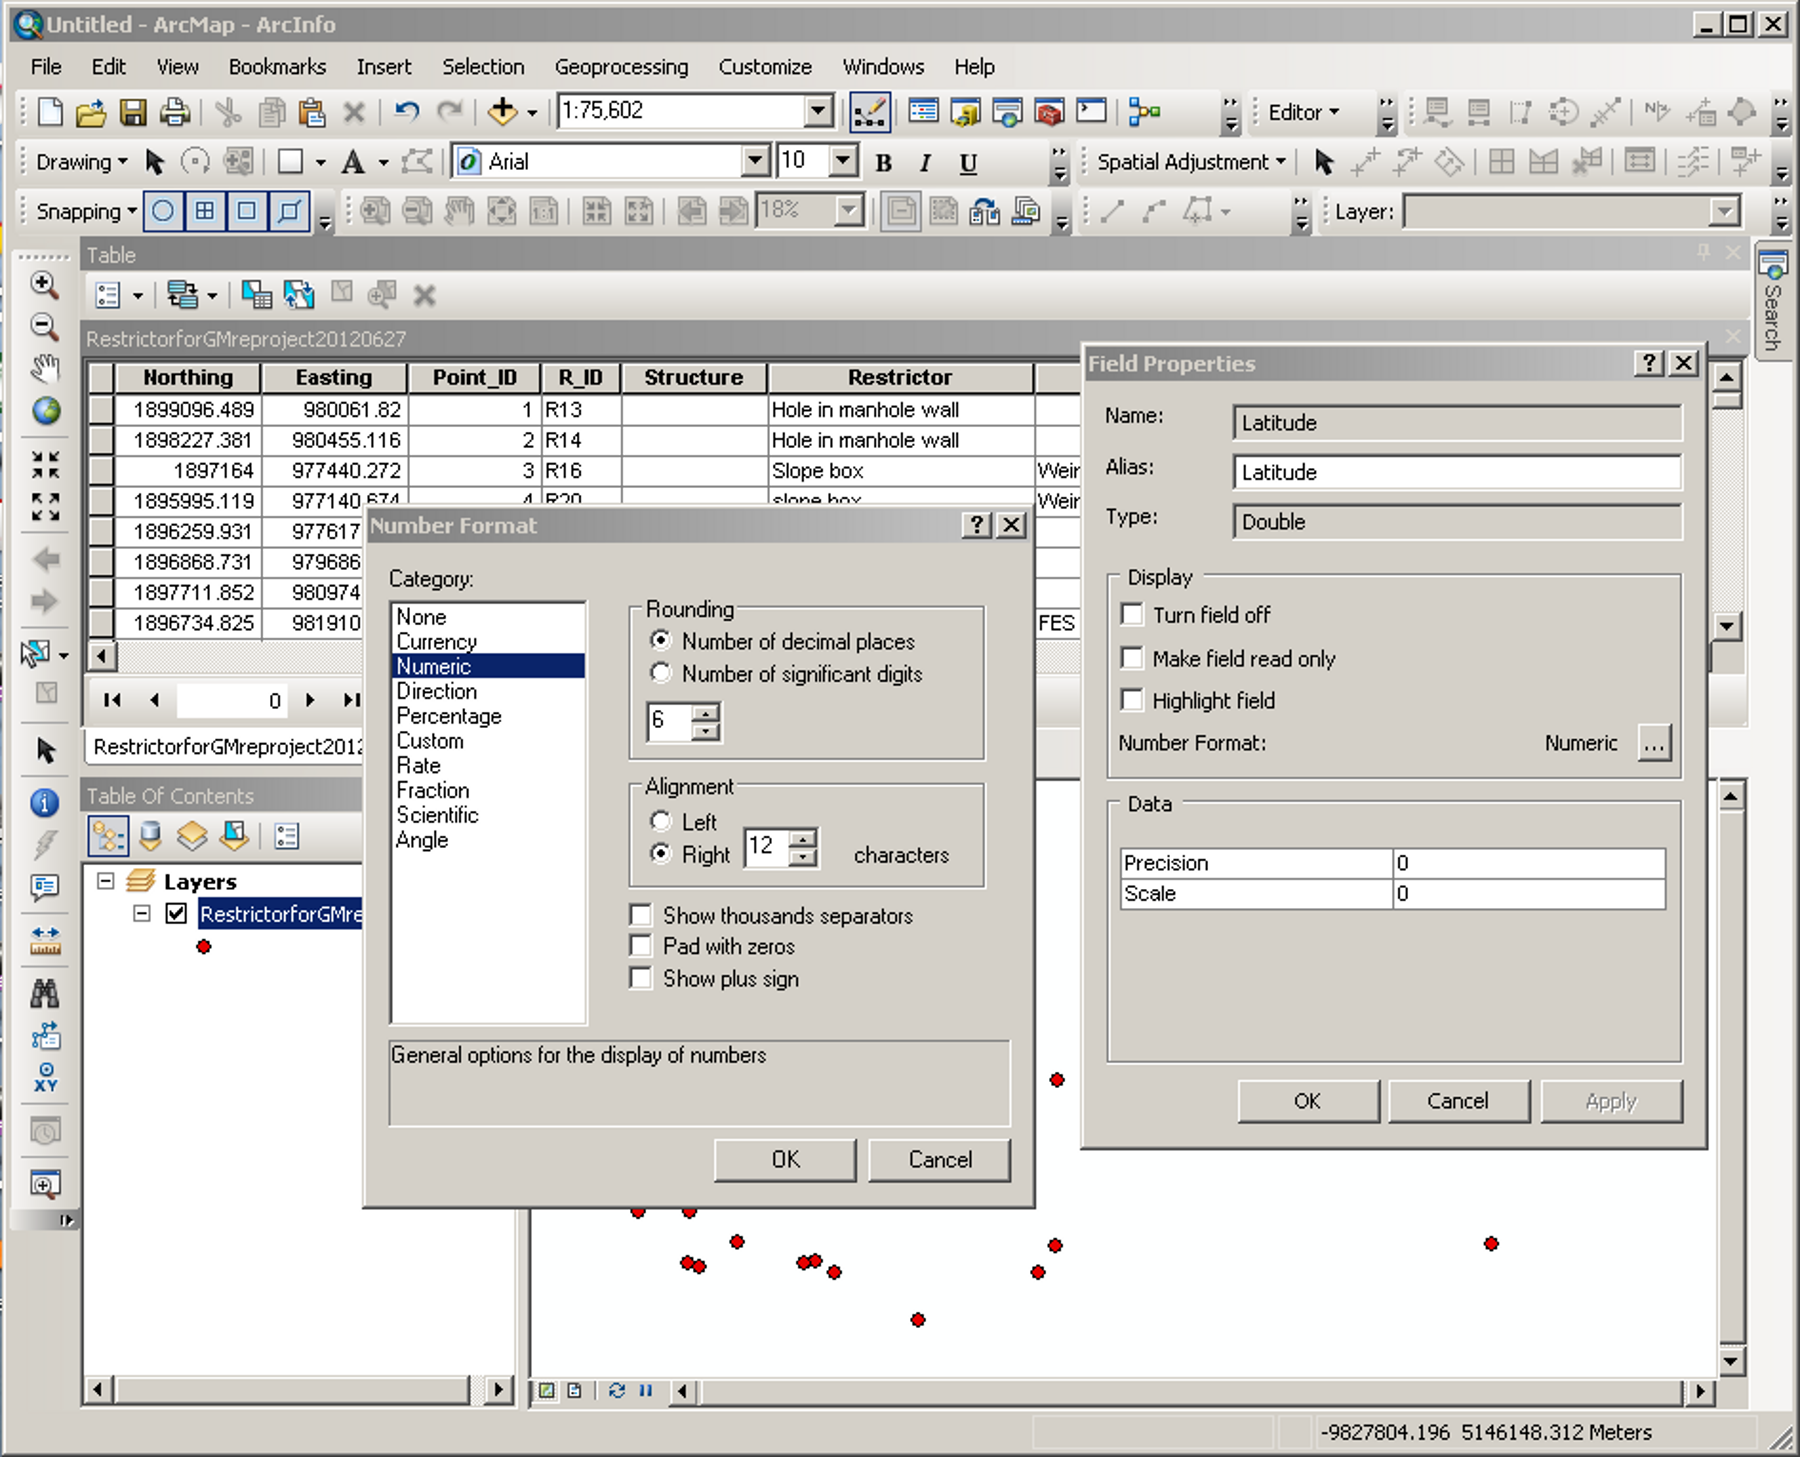
Formatting the latitude and longitude fields

This will bring up a Field Properties window. In this window there is a box next to the word “Numeric.” Click that box with the “. . .”—this should bring up a “Number Format” window. In this window make sure the Category is “Numeric” and the Rounding is shown to at least 6 decimal places. Then click “OK.” Do the same for the Longitude column.


Calculating the latitude/longitude

Now we are going to calculate the latitude and longitude. Go to the Editor menu and click “Start Editing.” Then click on the heading “Latitiude” to highlight that field. Right click and choose “Calculate Geometry” from the pop-up menu. The “Calculate Geometry” window will pop up. In this window, set the property for Latitude to the “Y Coordinate of Point.” For the Coordinate System, choose the “Use coordinate system of the data source.” And set the units to “Decimal Degrees.” When you click “OK” the computer will populate the column with the Latitude for each point. Do the same for the Longitude field except the property will be set as the “X Coordinate of the Point.” Then go back to the editor menu and choose “Save Edits” then “Stop Editing.” You now have a feature class on the correct projection for Google Maps with the Latitude and Longitude for each point!
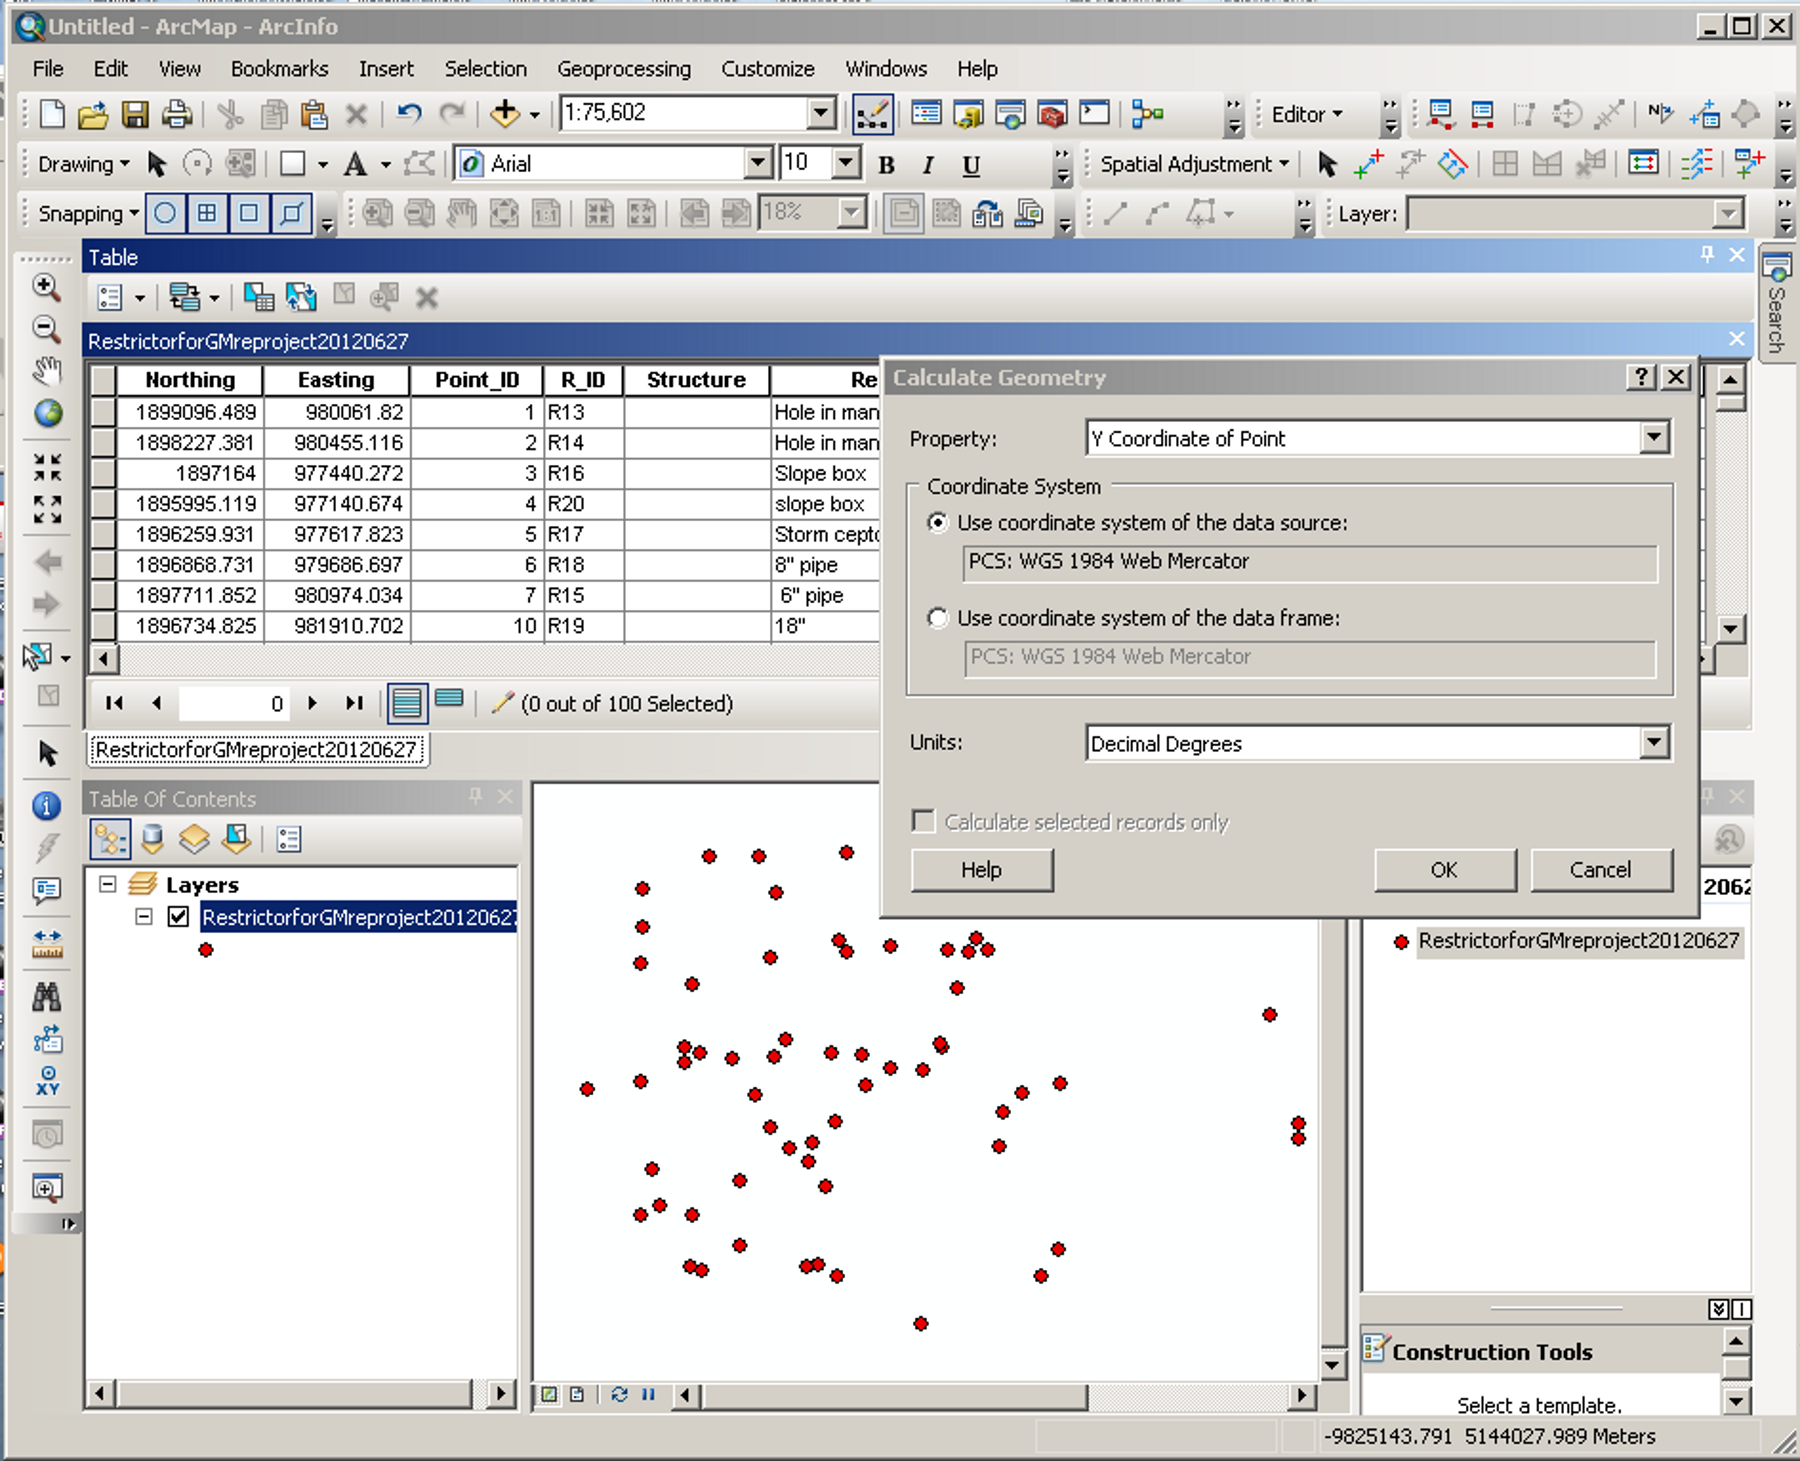
Calculating the latitude and longitude of our data


Exporting your data to a database

Now we have to get that data out to a format we can upload to Google. So click on the left most icon in the top of the Table window just under the word “Table.” This should bring up a menu—choose “Export” from this menu which brings up the “Export Data” window. Because we have only one feature class we can leave the Export as “All records.” In the Output table, type in the location and file name you want to assign to the exported data—notice this will be exported in a dbf format.
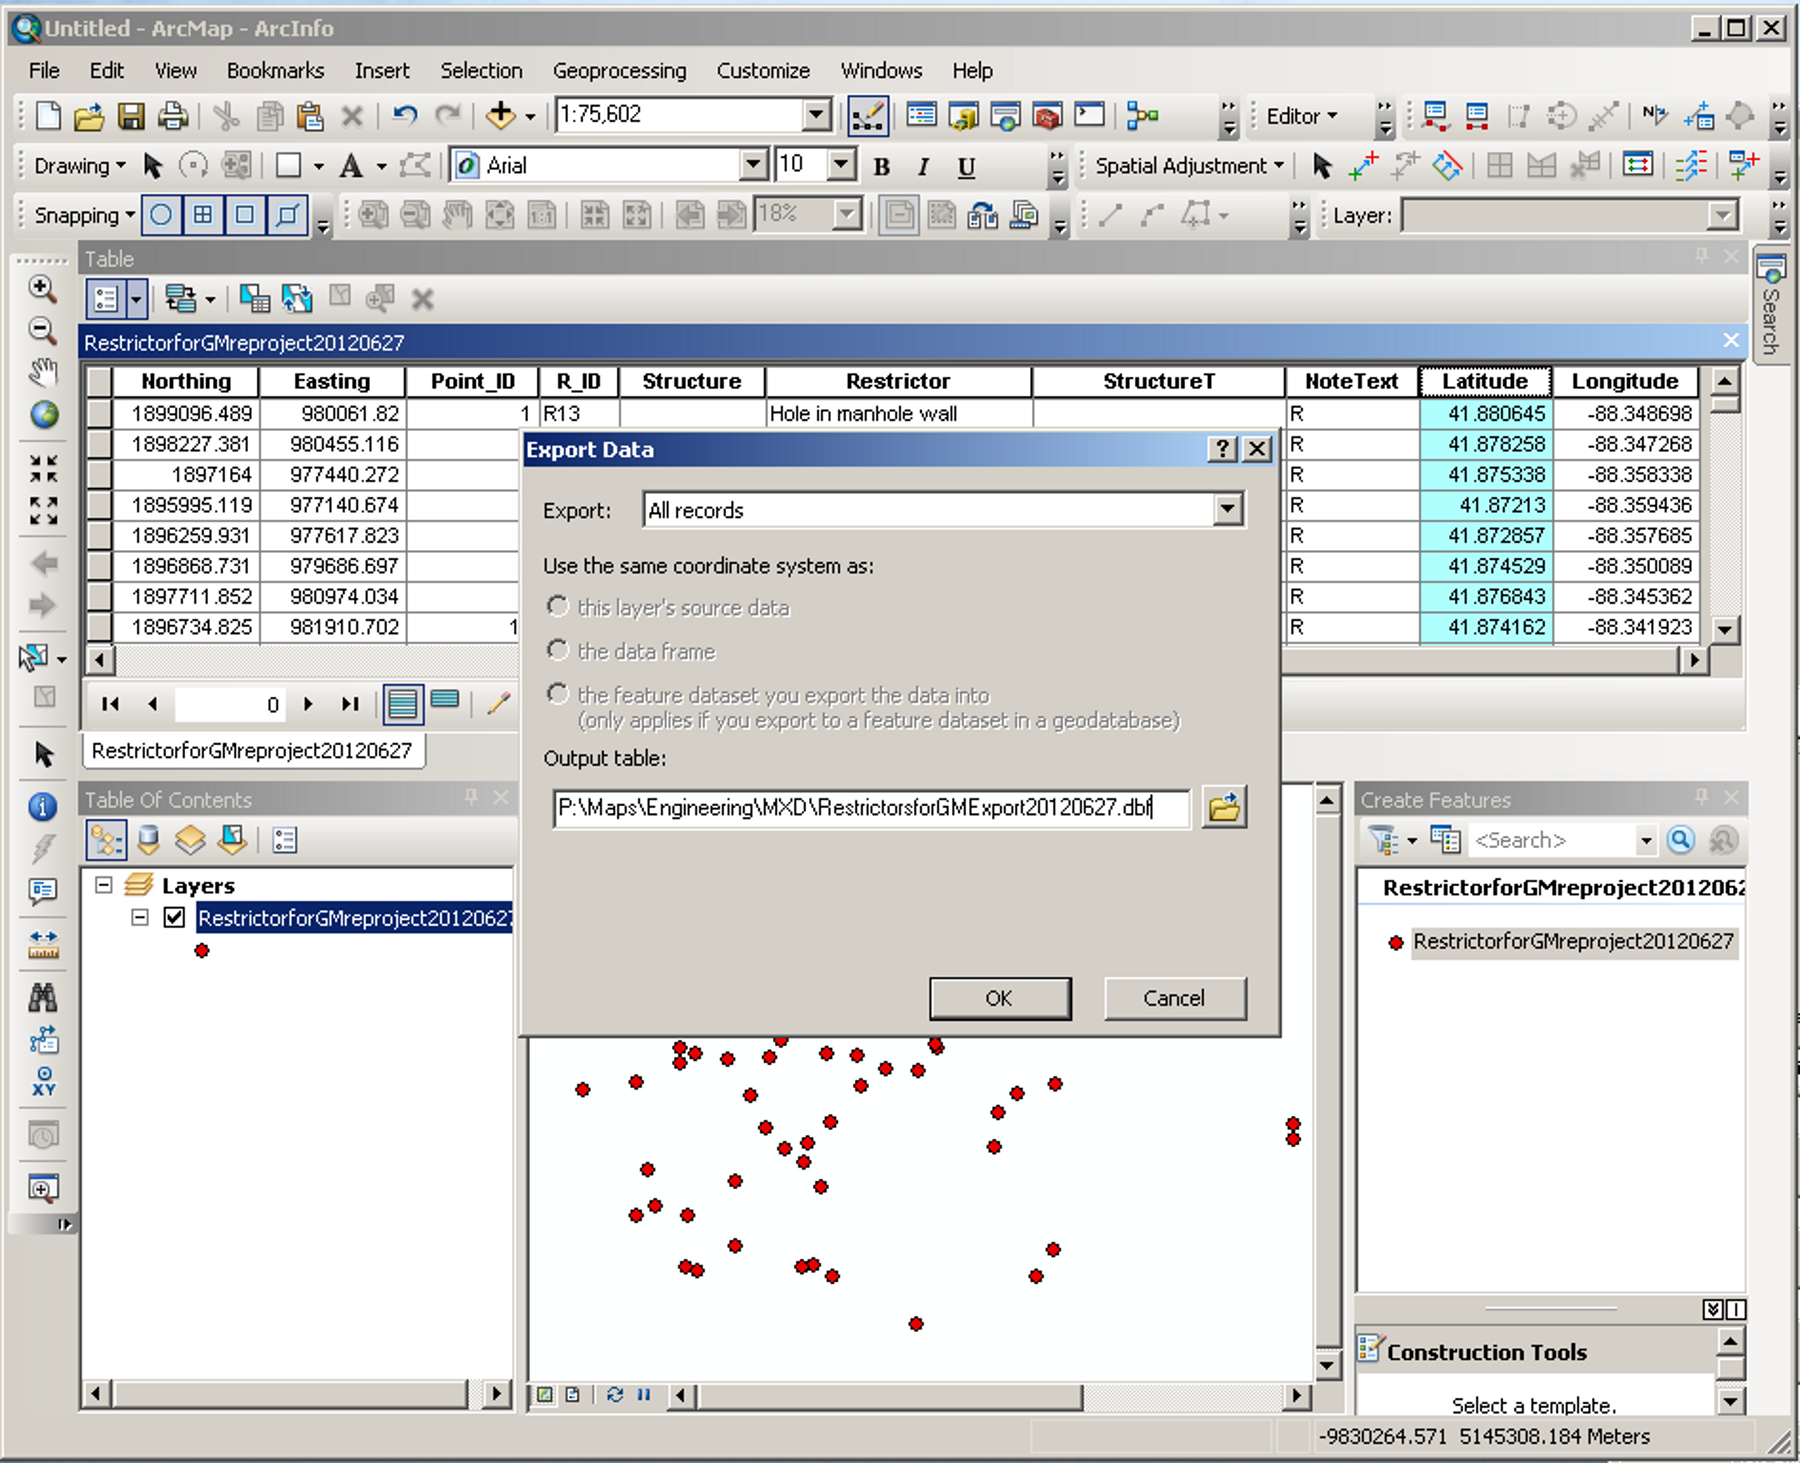
 

Exporting the attribute table to a database


Creating a spreadsheet and uploading to a Google Fusion Table

Now, navigate to that new dbf file and open it in MS Excel. Remove any columns you might not need and make any other edits you require (just don’t change the latitude or longitude columns) and save it as a MS Excel file. Go to your Google Documents account and click “Create.” Then from the list of document types, choose “Table (beta).” You will be given the choice of importing a new table from your computer, a Google spreadsheet or create an empty table. We are going to upload our new MS Excel file. Then continue through the prompts until you find yourself looking at your new table.
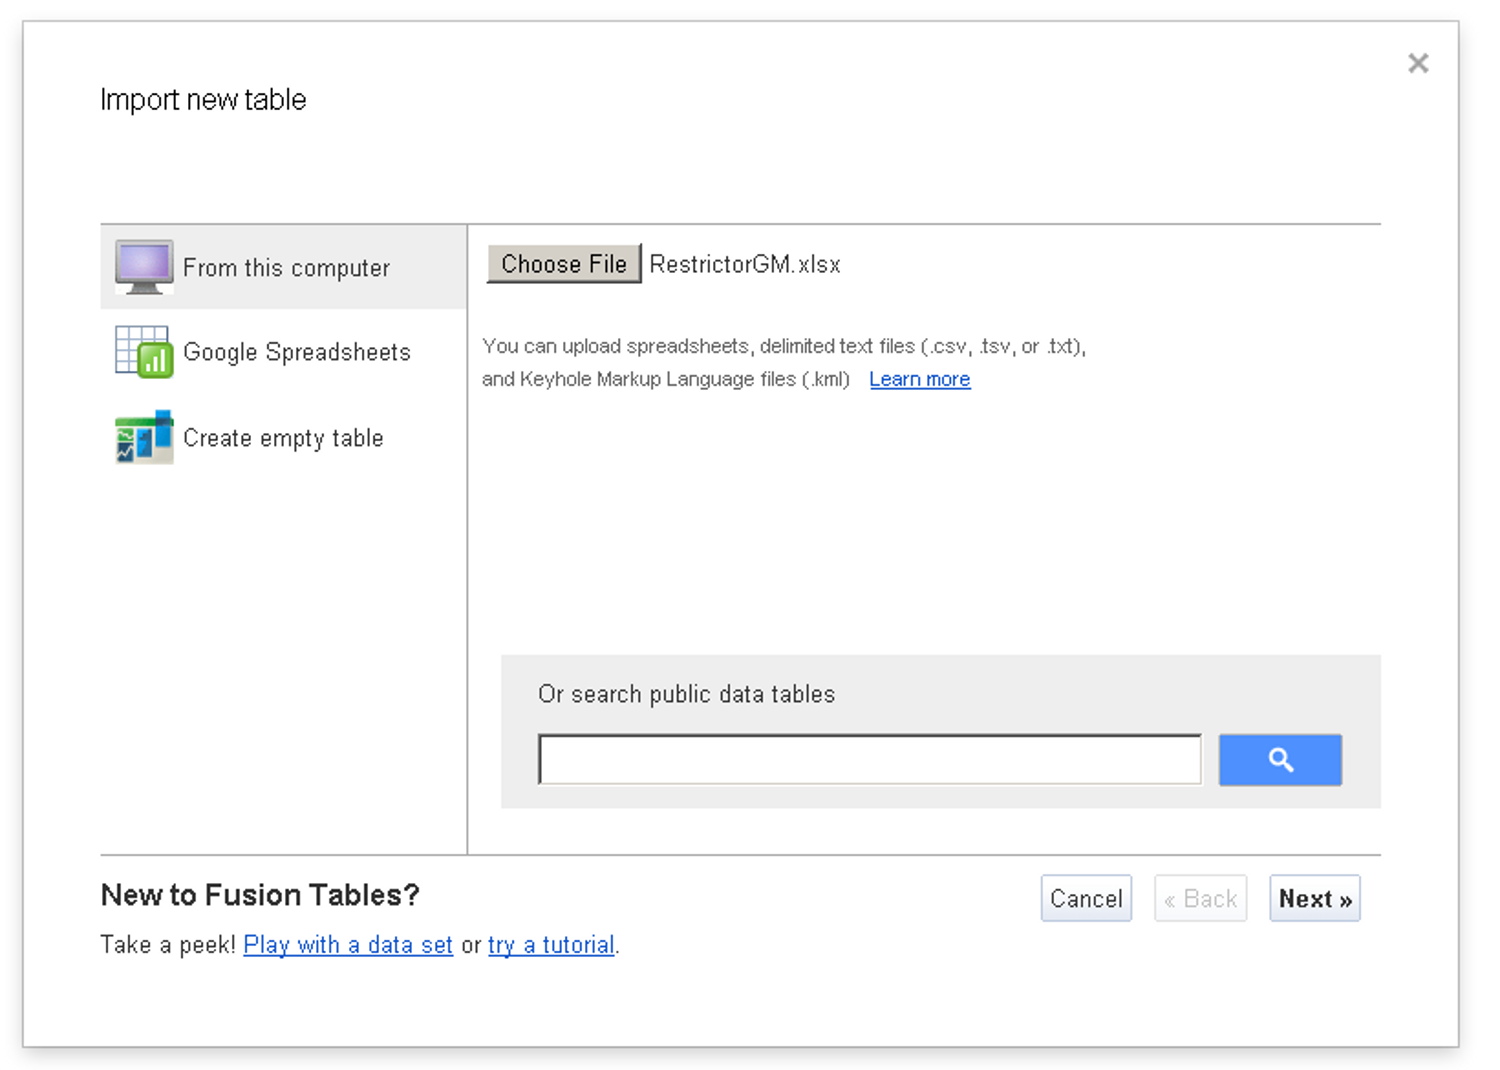
Uploading a spreadsheet to create a Google Fusion Table

(In my example, I have renamed my file to something other than the name used in my export to the database. This is because I merged other data into the database once I had it in MS Excel. And it helps remind me the MS Excel file is not exactly the same as the original, exported database file.)
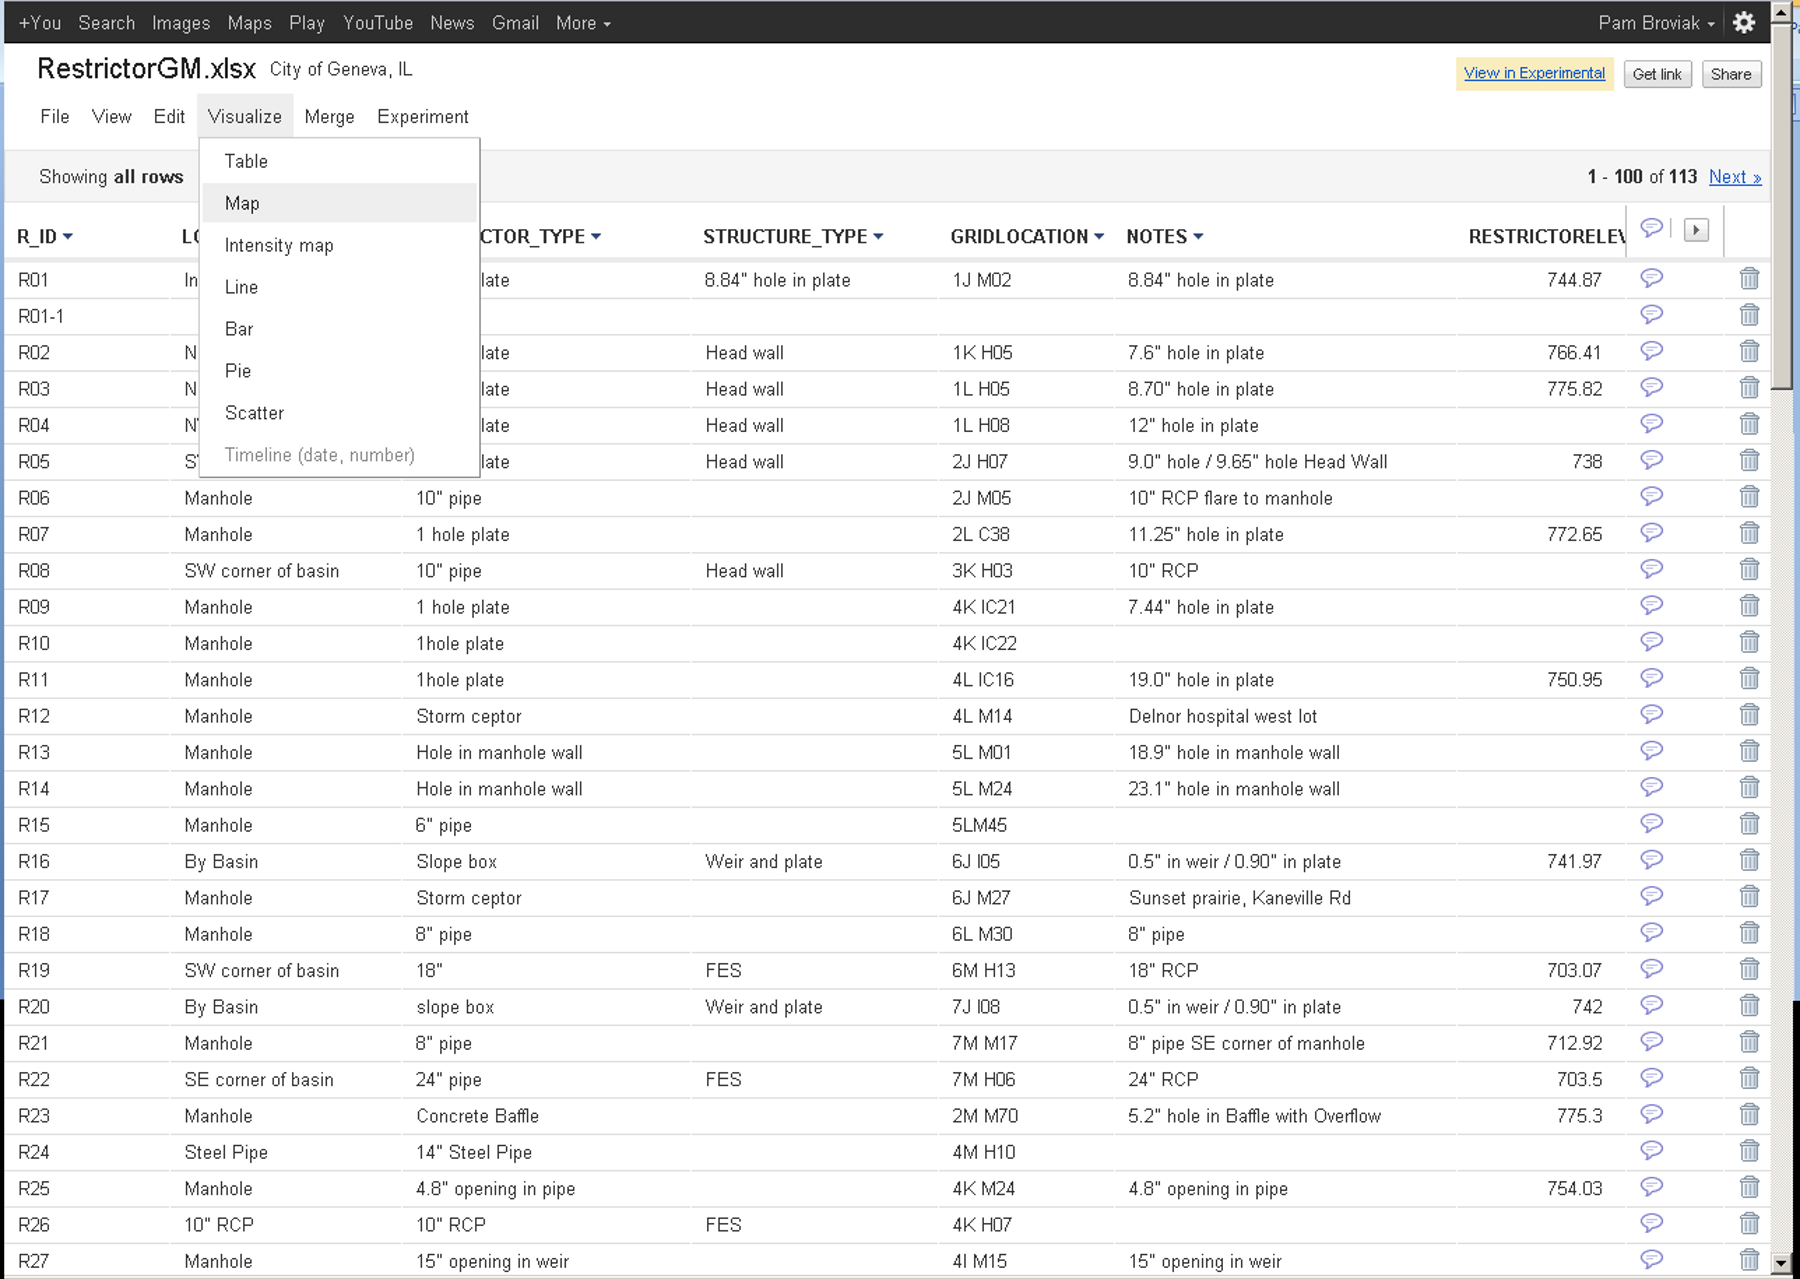
 

Example of a Google Fusion Table with data exported from a GIS to a spreadsheet and uploaded to Google


View your data in a Google Map

Above is an example of what the Google Fusion Table looks like with your uploaded data. Viewing the points on the map now is as easy as clicking “Visualize” and then “Map.”
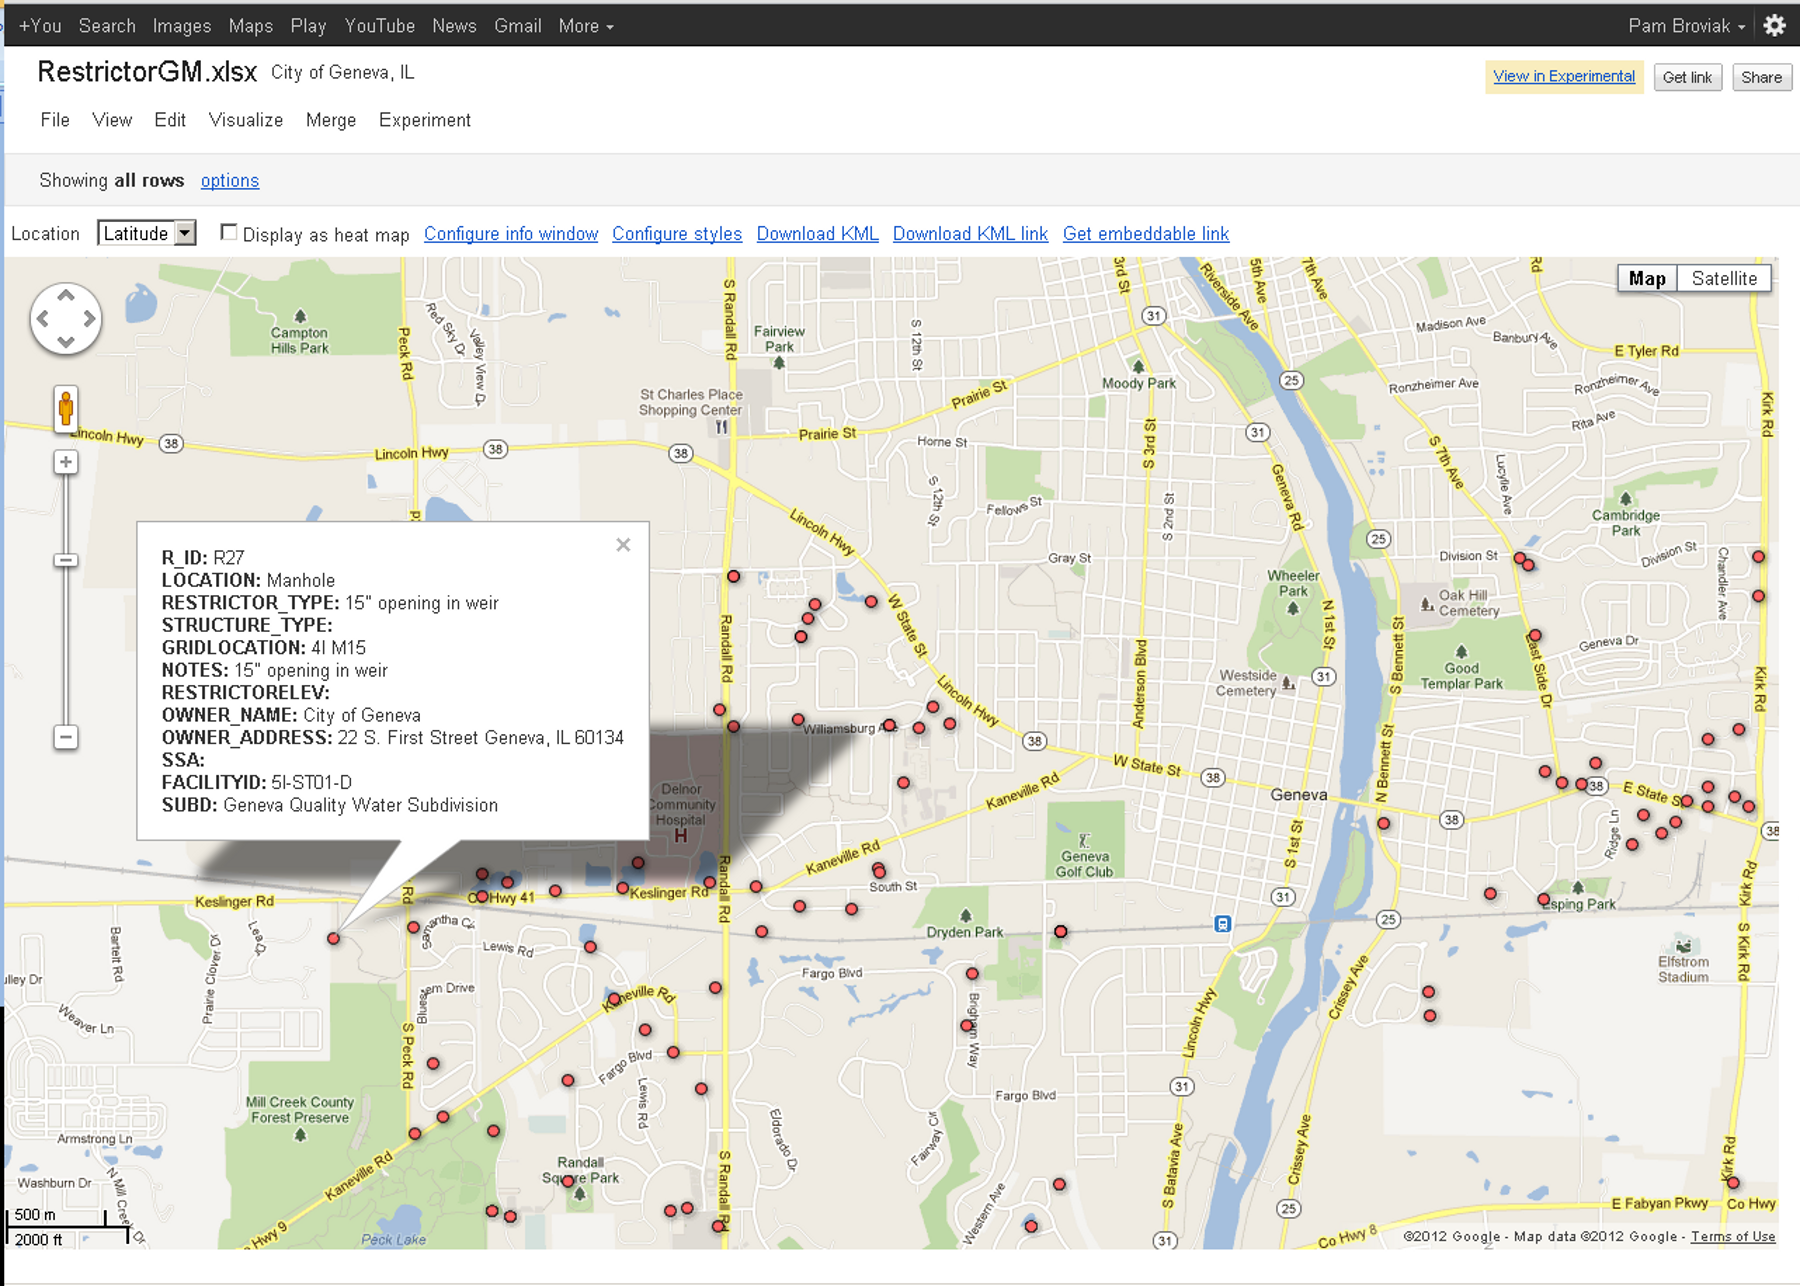
 

GIS data displayed in a Google Map using a Google Fusion Table

And below is the map of this data—I have clicked one of the points to show the data behind it. You also have the option to configure this info window using html. You can also put links in this window, but so far I've only gotten the link to work to an actual website and not to a local file.
Share